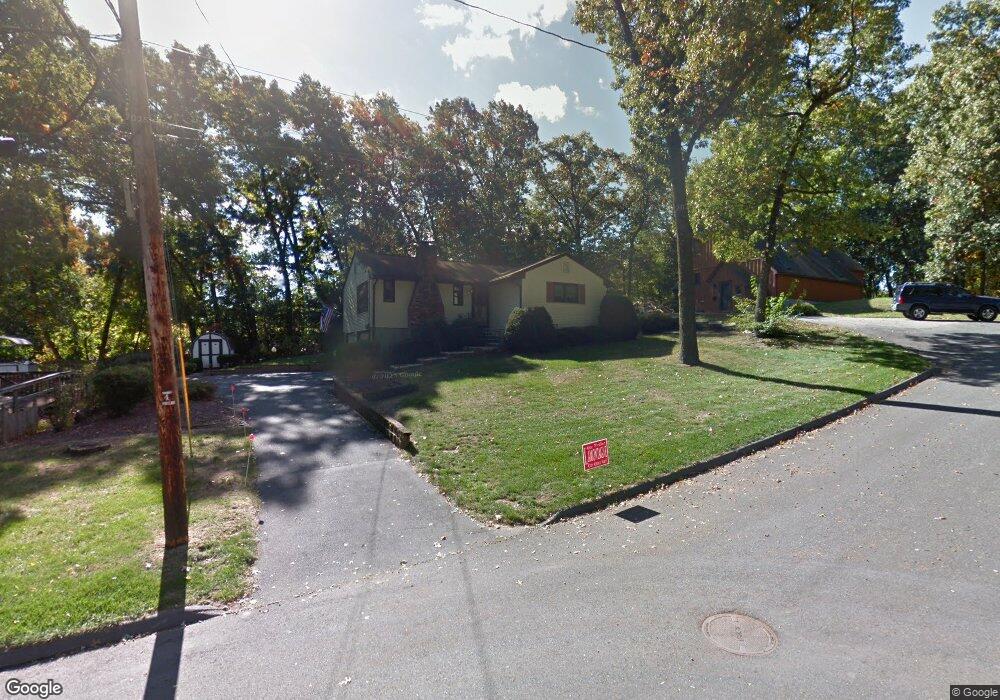
67 Tanglewood St Chicopee, MA 01020
Westover NeighborhoodEstimated Value: $324,066 - $338,000
3
Beds
1
Bath
1,116
Sq Ft
$298/Sq Ft
Est. Value
About This Home
This home is located at 67 Tanglewood St, Chicopee, MA 01020 and is currently estimated at $332,517, approximately $297 per square foot. 67 Tanglewood St is a home located in Hampden County with nearby schools including Bowie Elementary School, Fairview Middle School, and Chicopee Comprehensive High School.
Ownership History
Date
Name
Owned For
Owner Type
Purchase Details
Closed on
Jun 25, 2001
Sold by
Horniak Bernard J and Horniak Susan M
Bought by
Gauthier Arthur J and Gauthier Joan J
Current Estimated Value
Home Financials for this Owner
Home Financials are based on the most recent Mortgage that was taken out on this home.
Original Mortgage
$60,000
Outstanding Balance
$23,038
Interest Rate
7.09%
Mortgage Type
Purchase Money Mortgage
Estimated Equity
$309,479
Create a Home Valuation Report for This Property
The Home Valuation Report is an in-depth analysis detailing your home's value as well as a comparison with similar homes in the area
Home Values in the Area
Average Home Value in this Area
Purchase History
| Date | Buyer | Sale Price | Title Company |
|---|---|---|---|
| Gauthier Arthur J | $129,900 | -- |
Source: Public Records
Mortgage History
| Date | Status | Borrower | Loan Amount |
|---|---|---|---|
| Open | Gauthier Arthur J | $60,000 |
Source: Public Records
Tax History
| Year | Tax Paid | Tax Assessment Tax Assessment Total Assessment is a certain percentage of the fair market value that is determined by local assessors to be the total taxable value of land and additions on the property. | Land | Improvement |
|---|---|---|---|---|
| 2025 | $4,274 | $281,900 | $111,600 | $170,300 |
| 2024 | $4,053 | $274,600 | $109,400 | $165,200 |
| 2023 | $3,760 | $248,200 | $99,500 | $148,700 |
| 2022 | $3,585 | $211,000 | $86,500 | $124,500 |
| 2021 | $3,425 | $194,500 | $78,600 | $115,900 |
| 2020 | $3,300 | $189,000 | $80,800 | $108,200 |
| 2019 | $3,256 | $181,300 | $80,800 | $100,500 |
| 2018 | $3,180 | $173,700 | $76,900 | $96,800 |
| 2017 | $3,116 | $180,000 | $70,600 | $109,400 |
| 2016 | $2,897 | $171,300 | $70,600 | $100,700 |
| 2015 | $2,998 | $170,900 | $70,600 | $100,300 |
| 2014 | $1,499 | $170,900 | $70,600 | $100,300 |
Source: Public Records
Map
Nearby Homes
- 1697 Westover Rd
- 111 Festival Cir
- 52 Falmouth Rd
- 179 Greenwood Terrace
- 38 Applewood Dr
- 103 Lauzier Terrace
- 70 Greenwood Terrace
- 37 Greenwood Terrace
- 58 Robinridge Rd
- 119 Oakridge St
- 461 Sheridan St
- 460 Irene St
- 210 Johnson Rd Unit 23
- 340 Pendleton Ave
- 104 Johnson Rd Unit 1103
- 104 Johnson Rd Unit 707
- 1246 Granby Rd Unit 43
- 1246 Granby Rd Unit 66
- 83 Old Farm Rd
- 41 Oakhill Cir Unit 41
- 57 Tanglewood St
- 77 Tanglewood St
- 124 Marten St
- 125 Marten St
- 47 Tanglewood St
- 5 Stockbridge St
- 117 Marten St
- 126 Garland St
- 116 Marten St
- 1700 Westover Rd
- 2 Stockbridge St
- 37 Tanglewood St
- 109 Marten St
- 11 Stockbridge St
- 116 Garland St
- 123 Garland St
- 101 Marten St
- 27 Tanglewood St
- 1714 Westover Rd
- 106 Marten St
Your Personal Tour Guide
Ask me questions while you tour the home.