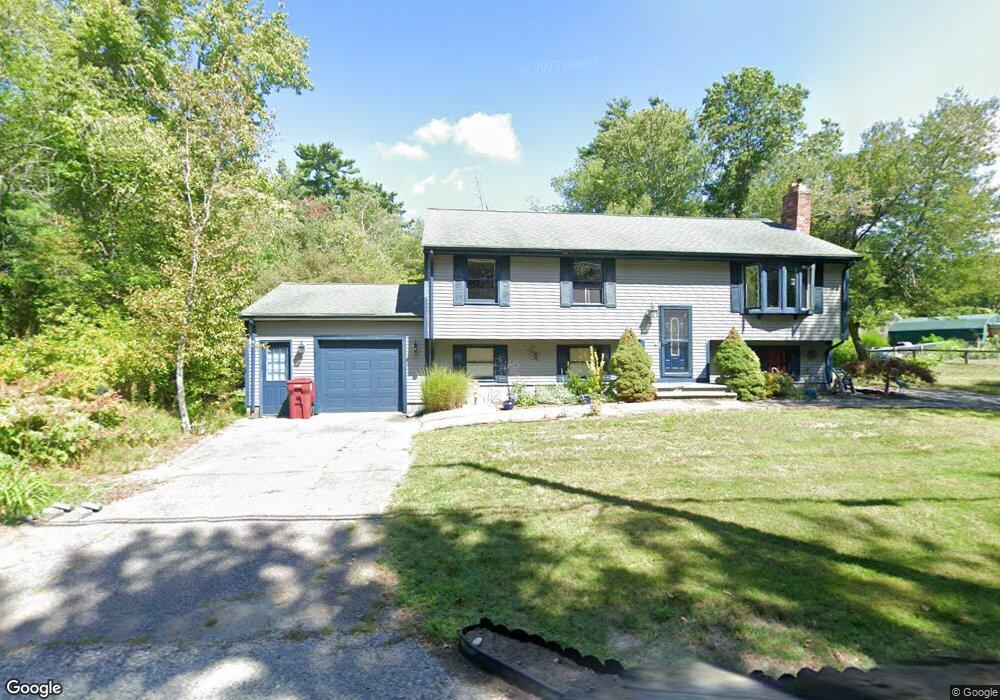
67 Vaughan St Middleboro, MA 02346
Estimated Value: $527,000 - $590,243
3
Beds
2
Baths
1,092
Sq Ft
$514/Sq Ft
Est. Value
About This Home
This home is located at 67 Vaughan St, Middleboro, MA 02346 and is currently estimated at $561,811, approximately $514 per square foot. 67 Vaughan St is a home located in Plymouth County with nearby schools including Mary K. Goode Elementary School and Mullein Hill Christian Academy.
Ownership History
Date
Name
Owned For
Owner Type
Purchase Details
Closed on
Aug 22, 2008
Sold by
Valentim Robert C and Valentim Rahira N
Bought by
Hannigan Edward P and Stratton Victoria
Current Estimated Value
Home Financials for this Owner
Home Financials are based on the most recent Mortgage that was taken out on this home.
Original Mortgage
$247,500
Interest Rate
6.4%
Mortgage Type
Purchase Money Mortgage
Purchase Details
Closed on
Dec 19, 1989
Sold by
Mtg Corp Of New Eng
Bought by
Punjab Rt
Create a Home Valuation Report for This Property
The Home Valuation Report is an in-depth analysis detailing your home's value as well as a comparison with similar homes in the area
Home Values in the Area
Average Home Value in this Area
Purchase History
| Date | Buyer | Sale Price | Title Company |
|---|---|---|---|
| Hannigan Edward P | $275,000 | -- | |
| Punjab Rt | $85,500 | -- |
Source: Public Records
Mortgage History
| Date | Status | Borrower | Loan Amount |
|---|---|---|---|
| Open | Punjab Rt | $256,715 | |
| Closed | Punjab Rt | $247,500 | |
| Previous Owner | Punjab Rt | $256,500 |
Source: Public Records
Tax History Compared to Growth
Tax History
| Year | Tax Paid | Tax Assessment Tax Assessment Total Assessment is a certain percentage of the fair market value that is determined by local assessors to be the total taxable value of land and additions on the property. | Land | Improvement |
|---|---|---|---|---|
| 2025 | $6,091 | $454,200 | $167,200 | $287,000 |
| 2024 | $5,746 | $424,400 | $159,400 | $265,000 |
| 2023 | $5,625 | $395,000 | $159,400 | $235,600 |
| 2022 | $5,209 | $338,700 | $138,600 | $200,100 |
| 2021 | $4,907 | $301,600 | $121,600 | $180,000 |
| 2020 | $4,847 | $305,200 | $121,600 | $183,600 |
| 2019 | $4,647 | $300,200 | $121,600 | $178,600 |
| 2018 | $4,373 | $280,300 | $115,500 | $164,800 |
| 2017 | $4,181 | $265,100 | $111,400 | $153,700 |
| 2016 | $3,867 | $242,900 | $102,000 | $140,900 |
| 2015 | $3,808 | $241,300 | $102,000 | $139,300 |
Source: Public Records
Map
Nearby Homes