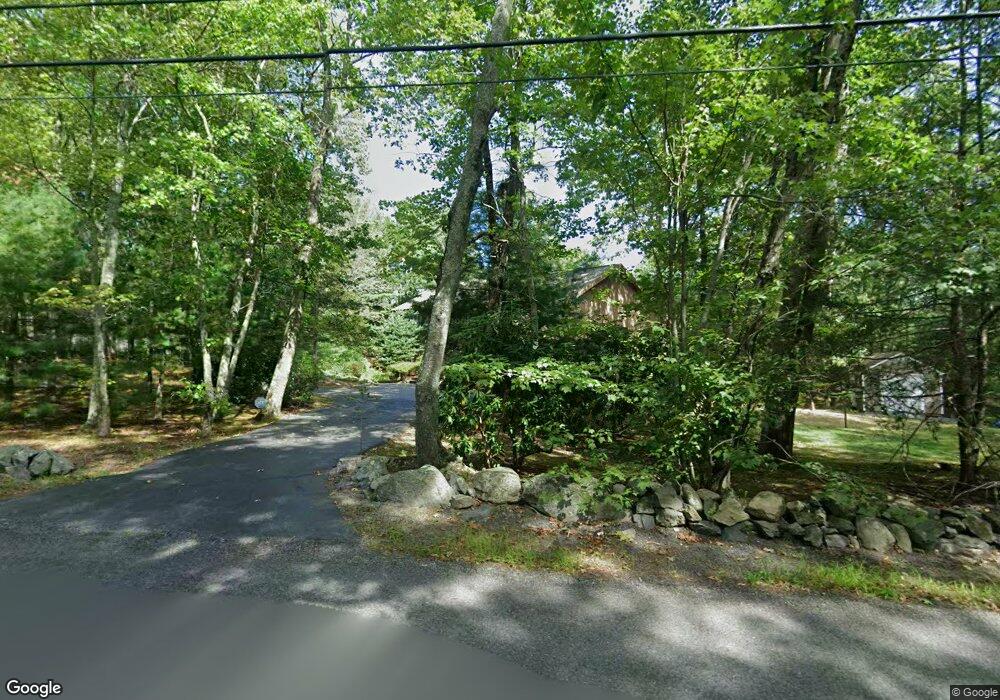
67 Walnut St Plainville, MA 02762
Estimated Value: $649,000 - $989,000
4
Beds
4
Baths
3,800
Sq Ft
$226/Sq Ft
Est. Value
About This Home
This home is located at 67 Walnut St, Plainville, MA 02762 and is currently estimated at $860,082, approximately $226 per square foot. 67 Walnut St is a home located in Norfolk County with nearby schools including Anna Ware Jackson School, Beatrice H. Wood Elementary School, and Cadence Academy Preschool - North Attleborough.
Ownership History
Date
Name
Owned For
Owner Type
Purchase Details
Closed on
Sep 17, 2014
Sold by
Summers Andre D and Summers Sharon M
Bought by
Summers Andre D and Summers Sharon M
Current Estimated Value
Purchase Details
Closed on
May 23, 2002
Sold by
Cendant Mobility Fncl
Bought by
Summers Andre D and Lachapelle Sharon M
Home Financials for this Owner
Home Financials are based on the most recent Mortgage that was taken out on this home.
Original Mortgage
$300,000
Interest Rate
7.01%
Mortgage Type
Purchase Money Mortgage
Purchase Details
Closed on
Oct 24, 2000
Sold by
Calvo Elisardo
Bought by
Hurt John D
Home Financials for this Owner
Home Financials are based on the most recent Mortgage that was taken out on this home.
Original Mortgage
$349,600
Interest Rate
7.88%
Mortgage Type
Purchase Money Mortgage
Create a Home Valuation Report for This Property
The Home Valuation Report is an in-depth analysis detailing your home's value as well as a comparison with similar homes in the area
Home Values in the Area
Average Home Value in this Area
Purchase History
| Date | Buyer | Sale Price | Title Company |
|---|---|---|---|
| Summers Andre D | -- | -- | |
| Summers Andre D | $445,000 | -- | |
| Fncl Cendany Mobility | $445,000 | -- | |
| Hurt John D | $437,000 | -- |
Source: Public Records
Mortgage History
| Date | Status | Borrower | Loan Amount |
|---|---|---|---|
| Previous Owner | Summers Andre D | $300,000 | |
| Previous Owner | Hurt John D | $349,600 | |
| Closed | Hurt John D | $65,550 |
Source: Public Records
Tax History Compared to Growth
Tax History
| Year | Tax Paid | Tax Assessment Tax Assessment Total Assessment is a certain percentage of the fair market value that is determined by local assessors to be the total taxable value of land and additions on the property. | Land | Improvement |
|---|---|---|---|---|
| 2025 | $90 | $775,300 | $248,600 | $526,700 |
| 2024 | $8,214 | $684,500 | $226,700 | $457,800 |
| 2023 | $7,904 | $633,300 | $226,700 | $406,600 |
| 2022 | $7,759 | $553,000 | $218,600 | $334,400 |
| 2021 | $8,129 | $553,000 | $218,600 | $334,400 |
| 2020 | $7,690 | $523,100 | $218,600 | $304,500 |
| 2019 | $8,006 | $534,800 | $208,600 | $326,200 |
| 2018 | $7,962 | $528,700 | $198,500 | $330,200 |
| 2017 | $8,556 | $570,400 | $208,100 | $362,300 |
| 2016 | $8,885 | $599,100 | $208,100 | $391,000 |
| 2015 | $7,867 | $510,200 | $172,800 | $337,400 |
| 2014 | $7,686 | $513,800 | $172,800 | $341,000 |
Source: Public Records
Map
Nearby Homes