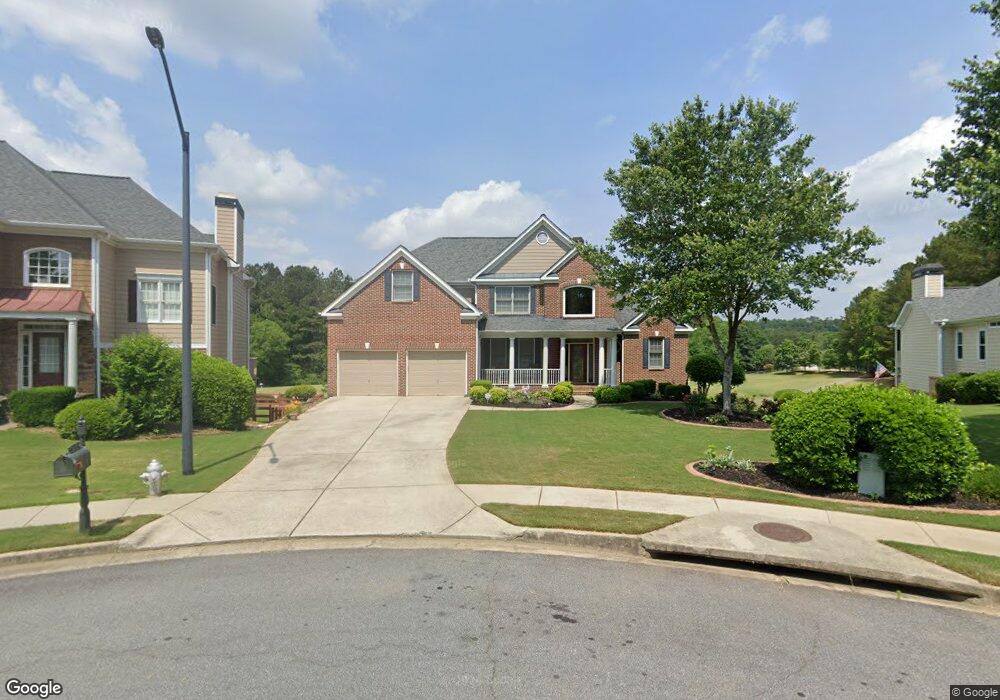
67 Waterstone Ct Acworth, GA 30101
Cedarcrest NeighborhoodEstimated Value: $571,960 - $793,000
5
Beds
4
Baths
3,301
Sq Ft
$209/Sq Ft
Est. Value
About This Home
This home is located at 67 Waterstone Ct, Acworth, GA 30101 and is currently estimated at $688,740, approximately $208 per square foot. 67 Waterstone Ct is a home located in Paulding County with nearby schools including Floyd L. Shelton Elementary School at Crossroad, Sammy Mcclure Sr. Middle School, and North Paulding High School.
Ownership History
Date
Name
Owned For
Owner Type
Purchase Details
Closed on
Sep 14, 2007
Sold by
Weichert Relocation Rsrcs Inc
Bought by
Simmons Joseph and Simmons Kimberly
Current Estimated Value
Home Financials for this Owner
Home Financials are based on the most recent Mortgage that was taken out on this home.
Original Mortgage
$325,850
Outstanding Balance
$206,094
Interest Rate
6.55%
Mortgage Type
New Conventional
Estimated Equity
$482,646
Purchase Details
Closed on
Jul 6, 2006
Sold by
Donovan Terry W and Donovan Nora J
Bought by
Weichert Relocation Rsrcs Inc
Purchase Details
Closed on
Feb 28, 2003
Sold by
Loren Construction Co Inc
Bought by
Donovan Terry W and Donovan Nora J
Home Financials for this Owner
Home Financials are based on the most recent Mortgage that was taken out on this home.
Original Mortgage
$295,730
Interest Rate
5.89%
Mortgage Type
New Conventional
Create a Home Valuation Report for This Property
The Home Valuation Report is an in-depth analysis detailing your home's value as well as a comparison with similar homes in the area
Home Values in the Area
Average Home Value in this Area
Purchase History
| Date | Buyer | Sale Price | Title Company |
|---|---|---|---|
| Simmons Joseph | $343,000 | -- | |
| Weichert Relocation Rsrcs Inc | $343,000 | -- | |
| Donovan Terry W | $369,700 | -- |
Source: Public Records
Mortgage History
| Date | Status | Borrower | Loan Amount |
|---|---|---|---|
| Open | Simmons Joseph | $325,850 | |
| Previous Owner | Donovan Terry W | $295,730 |
Source: Public Records
Tax History Compared to Growth
Tax History
| Year | Tax Paid | Tax Assessment Tax Assessment Total Assessment is a certain percentage of the fair market value that is determined by local assessors to be the total taxable value of land and additions on the property. | Land | Improvement |
|---|---|---|---|---|
| 2024 | $5,090 | $207,844 | $26,400 | $181,444 |
| 2023 | $5,449 | $211,552 | $26,400 | $185,152 |
| 2022 | $5,010 | $194,048 | $26,400 | $167,648 |
| 2021 | $4,575 | $159,304 | $26,400 | $132,904 |
| 2020 | $4,196 | $143,128 | $26,400 | $116,728 |
| 2019 | $3,988 | $134,220 | $26,400 | $107,820 |
| 2018 | $4,128 | $138,864 | $26,400 | $112,464 |
| 2017 | $3,758 | $124,864 | $26,400 | $98,464 |
| 2016 | $4,057 | $136,040 | $39,160 | $96,880 |
| 2015 | $3,913 | $129,000 | $39,160 | $89,840 |
| 2014 | $3,725 | $119,880 | $39,160 | $80,720 |
| 2013 | -- | $111,800 | $39,160 | $72,640 |
Source: Public Records
Map
Nearby Homes
- 109 Applewood Ln
- 183 Applewood Ln
- 174 Waterstone Point
- 179 Waterstone Point
- 51 Sagemont Ct
- 216 Brisbane Dr
- 32 Pullman Trail
- 57 Cedarcrest Village Ln
- 118 Cedarcrest Village Ct
- 127 Blazing Ridge Way
- 84 Cedarcrest Village Ln
- 171 Westbrook Dr
- 407 Estates View Dr
- 76 Ashdowne Way
- 119 Terrace View Dr
- 247 Terrace View Dr
- 109 Rocky Point Ct
- 77 Waterstone Ct Unit N
- 55 Waterstone Ct
- 55 Waterstone Ct Unit 55
- 55 Waterstone Ct Unit N
- 55 Waterstone Ct
- 55 Watestone
- 39 Waterstone Ct
- 0 Waterstone Ct Unit 8089079
- 0 Waterstone Ct Unit 7495212
- 54 Waterstone Ct
- 25 Waterstone Ct Unit N
- 87 Applewood Ln
- 129 Applewood Ln
- 71 Applewood Ln
- 14 Waterstone Point
- 9 Waterstone Ct
- 149 Applewood Ln
- 14 Waterstone Ct Unit PTE
- 14 Waterstone Ct Unit 14
- 0 Applewood Ln Unit 8786075