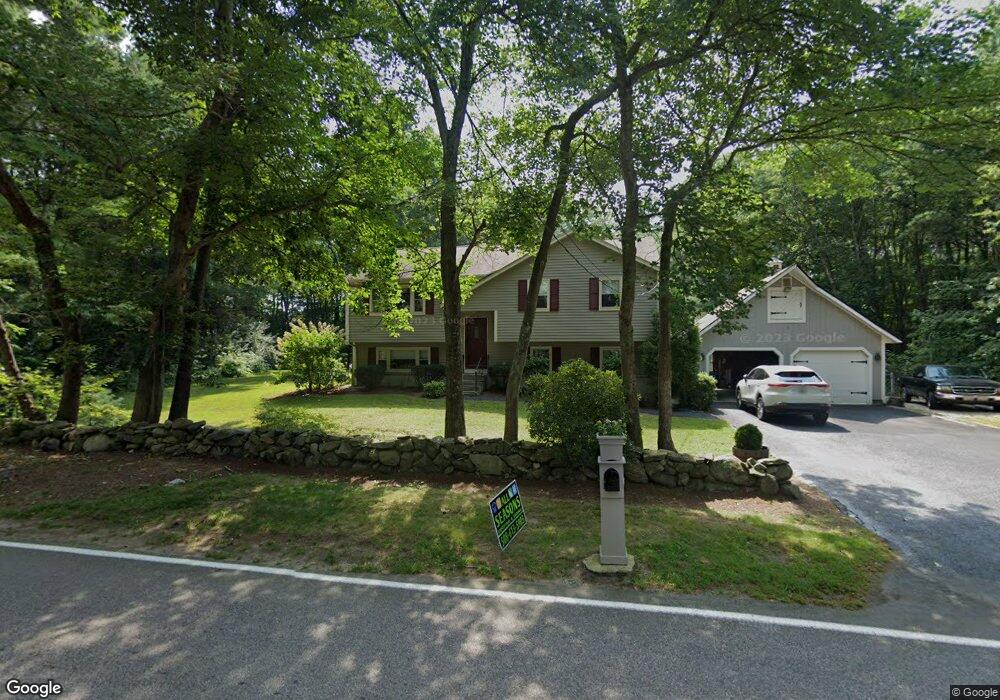
67 West St Medway, MA 02053
Estimated Value: $552,000 - $647,000
3
Beds
2
Baths
1,185
Sq Ft
$502/Sq Ft
Est. Value
About This Home
This home is located at 67 West St, Medway, MA 02053 and is currently estimated at $595,285, approximately $502 per square foot. 67 West St is a home located in Norfolk County with nearby schools including John D. McGovern Elementary School, Burke-Memorial Elementary, and Medway Middle School.
Ownership History
Date
Name
Owned For
Owner Type
Purchase Details
Closed on
Jul 21, 2006
Sold by
Swanson Gerald R
Bought by
Gerald R Swanson Ret and Swanson Gerald R
Current Estimated Value
Purchase Details
Closed on
Aug 28, 1995
Sold by
White Phillip E and White Elizabeth A
Bought by
Swanson Gerald R
Home Financials for this Owner
Home Financials are based on the most recent Mortgage that was taken out on this home.
Original Mortgage
$106,000
Interest Rate
7.32%
Mortgage Type
Purchase Money Mortgage
Create a Home Valuation Report for This Property
The Home Valuation Report is an in-depth analysis detailing your home's value as well as a comparison with similar homes in the area
Home Values in the Area
Average Home Value in this Area
Purchase History
| Date | Buyer | Sale Price | Title Company |
|---|---|---|---|
| Gerald R Swanson Ret | -- | -- | |
| Swanson Gerald R | $171,000 | -- |
Source: Public Records
Mortgage History
| Date | Status | Borrower | Loan Amount |
|---|---|---|---|
| Open | Swanson Gerald R | $200,000 | |
| Previous Owner | Swanson Gerald R | $106,000 | |
| Previous Owner | Swanson Gerald R | $70,000 | |
| Previous Owner | Swanson Gerald R | $51,500 |
Source: Public Records
Tax History
| Year | Tax Paid | Tax Assessment Tax Assessment Total Assessment is a certain percentage of the fair market value that is determined by local assessors to be the total taxable value of land and additions on the property. | Land | Improvement |
|---|---|---|---|---|
| 2025 | $7,605 | $533,700 | $271,100 | $262,600 |
| 2024 | $7,685 | $533,700 | $271,100 | $262,600 |
| 2023 | $7,674 | $481,400 | $233,500 | $247,900 |
| 2022 | $7,258 | $428,700 | $208,500 | $220,200 |
| 2021 | $7,049 | $403,700 | $187,700 | $216,000 |
| 2020 | $6,634 | $379,100 | $166,800 | $212,300 |
| 2019 | $6,591 | $388,400 | $183,500 | $204,900 |
| 2018 | $6,352 | $359,700 | $158,500 | $201,200 |
| 2017 | $6,057 | $338,000 | $158,500 | $179,500 |
| 2016 | $5,788 | $319,600 | $140,100 | $179,500 |
| 2015 | $5,585 | $306,200 | $125,100 | $181,100 |
| 2014 | $5,475 | $290,600 | $133,500 | $157,100 |
Source: Public Records
Map
Nearby Homes
- 22 Granite St
- 15 Fox Run Rd
- 42 Fisher St
- 56 Fisher St
- 28 Fisher St
- 462 Hartford Ave
- 2 Kingson Ln Unit 2
- 8 Liberty Rd
- 394 Village St
- 6 Freedom Trail
- 23 Cedar Farms Rd
- 22 Milford St
- 4 Linda Ln
- 8 Apache Rd
- 56 Puddingstone Ln
- 10 Franklin St
- 19 Sahlin Cir
- 21 Carp Rd
- 429 South St
- 20 Hawthorne Village Unit A
- 65 West St
- 4 Holbrook St
- 2 Holbrook St
- 75 West St
- 10 Williamsburg Way
- 21 Williamsburg Way Unit 21
- 23 Williamsburg Way
- 21 Williamsburg Way
- 23 Williamsburg Way
- 21 Williamsburg Way
- 68 West St
- 63 West St
- 1 Holbrook St
- 6 Holbrook St
- 8 Holbrook St
- 77 West St
- 15 Holbrook St
- 3 Holbrook St
- 17 Williamsburg Way
- 17 Williamsburg Way
Your Personal Tour Guide
Ask me questions while you tour the home.