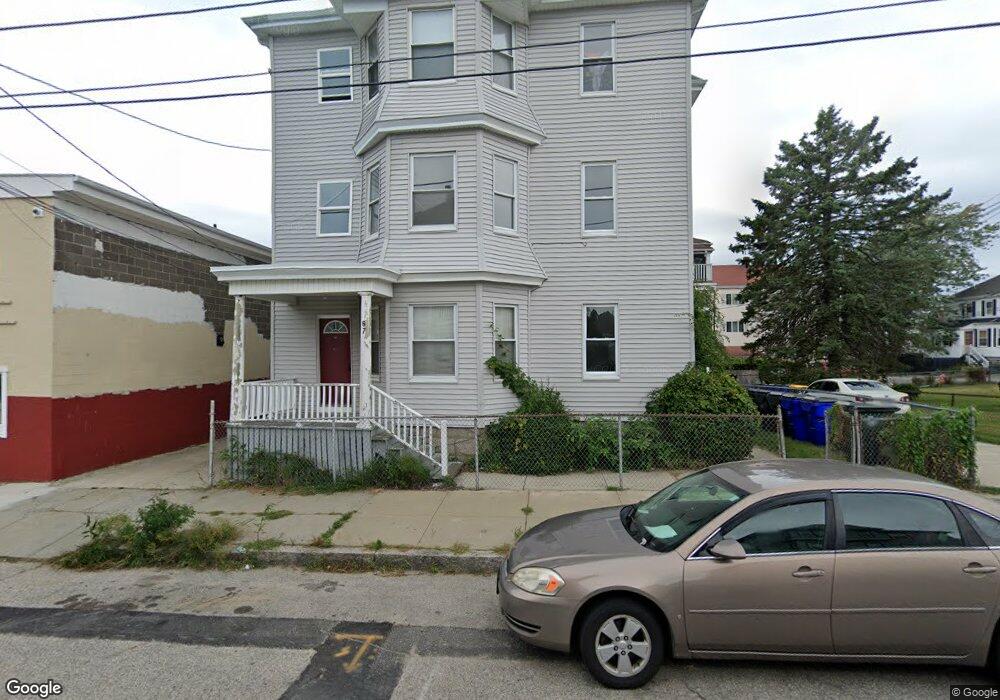
67 Wilbur St Unit 3 Fall River, MA 02724
Father Kelly NeighborhoodEstimated Value: $537,000 - $625,000
2
Beds
1
Bath
1,170
Sq Ft
$485/Sq Ft
Est. Value
About This Home
This home is located at 67 Wilbur St Unit 3, Fall River, MA 02724 and is currently estimated at $566,998, approximately $484 per square foot. 67 Wilbur St Unit 3 is a home located in Bristol County with nearby schools including Carlton M. Viveiros Elementary School, Matthew J. Kuss Middle School, and B M C Durfee High School.
Ownership History
Date
Name
Owned For
Owner Type
Purchase Details
Closed on
Oct 2, 2018
Sold by
Jean Michael E
Bought by
Us Bank Na
Current Estimated Value
Purchase Details
Closed on
Nov 1, 1996
Sold by
Mello Raymond A and Mello James A
Bought by
Gomes Troy J and Gomes Elizabeth A
Home Financials for this Owner
Home Financials are based on the most recent Mortgage that was taken out on this home.
Original Mortgage
$105,900
Interest Rate
8.07%
Mortgage Type
Purchase Money Mortgage
Create a Home Valuation Report for This Property
The Home Valuation Report is an in-depth analysis detailing your home's value as well as a comparison with similar homes in the area
Home Values in the Area
Average Home Value in this Area
Purchase History
| Date | Buyer | Sale Price | Title Company |
|---|---|---|---|
| Us Bank Na | $239,429 | -- | |
| Gomes Troy J | $111,500 | -- |
Source: Public Records
Mortgage History
| Date | Status | Borrower | Loan Amount |
|---|---|---|---|
| Previous Owner | Gomes Troy J | $258,825 | |
| Previous Owner | Gomes Troy J | $225,782 | |
| Previous Owner | Gomes Troy J | $105,900 |
Source: Public Records
Tax History Compared to Growth
Tax History
| Year | Tax Paid | Tax Assessment Tax Assessment Total Assessment is a certain percentage of the fair market value that is determined by local assessors to be the total taxable value of land and additions on the property. | Land | Improvement |
|---|---|---|---|---|
| 2025 | $5,773 | $504,200 | $106,000 | $398,200 |
| 2024 | $5,522 | $480,600 | $102,100 | $378,500 |
| 2023 | $4,814 | $392,300 | $84,400 | $307,900 |
| 2022 | $4,283 | $339,400 | $80,300 | $259,100 |
| 2021 | $4,038 | $292,000 | $76,400 | $215,600 |
| 2020 | $3,623 | $250,700 | $75,300 | $175,400 |
| 2019 | $3,084 | $211,500 | $72,500 | $139,000 |
| 2018 | $2,968 | $203,000 | $78,600 | $124,400 |
| 2017 | $2,790 | $199,300 | $74,900 | $124,400 |
| 2016 | $2,738 | $200,900 | $79,700 | $121,200 |
| 2015 | $2,628 | $200,900 | $79,700 | $121,200 |
| 2014 | $2,647 | $210,400 | $77,300 | $133,100 |
Source: Public Records
Map
Nearby Homes