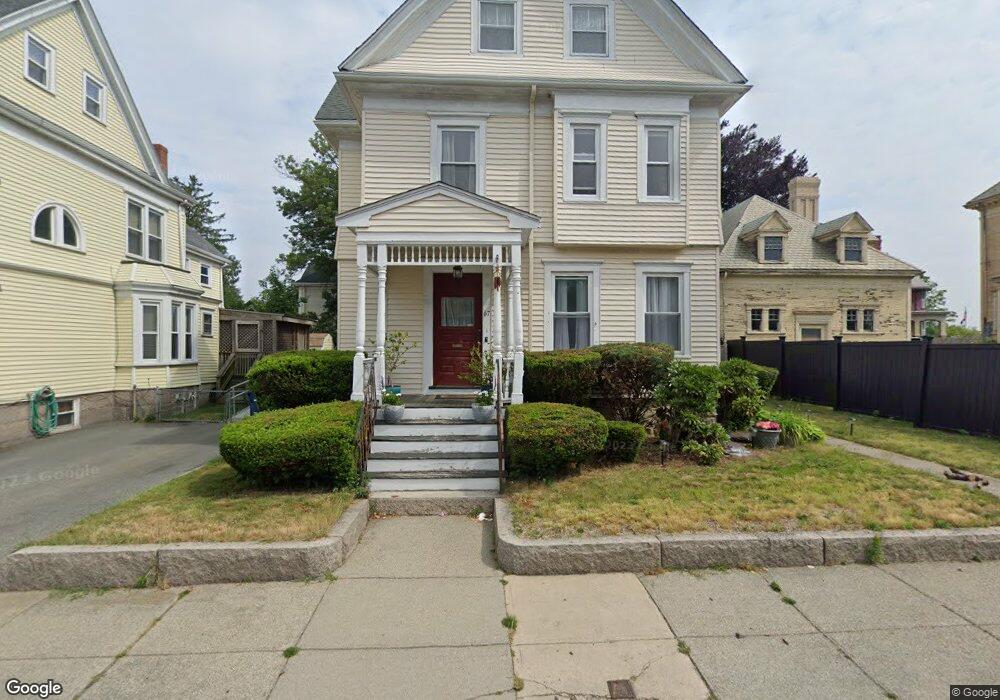
67 Willis St Unit 1 New Bedford, MA 02740
Downtown New Bedford NeighborhoodEstimated Value: $478,000 - $588,000
7
Beds
3
Baths
3,092
Sq Ft
$171/Sq Ft
Est. Value
About This Home
This home is located at 67 Willis St Unit 1, New Bedford, MA 02740 and is currently estimated at $527,788, approximately $170 per square foot. 67 Willis St Unit 1 is a home located in Bristol County with nearby schools including John Avery Parker, Keith Middle School, and New Bedford High School.
Ownership History
Date
Name
Owned For
Owner Type
Purchase Details
Closed on
May 31, 2016
Sold by
Morrissey 3Rd Gerald A and Morrissey Kara L
Bought by
Mendonca John
Current Estimated Value
Home Financials for this Owner
Home Financials are based on the most recent Mortgage that was taken out on this home.
Original Mortgage
$205,214
Outstanding Balance
$164,279
Interest Rate
3.75%
Mortgage Type
FHA
Estimated Equity
$363,509
Purchase Details
Closed on
Jun 20, 2005
Sold by
Young Irene J and Young Robert W
Bought by
Morrissey 3Rd Gerald A and Morrissey Kara L B
Home Financials for this Owner
Home Financials are based on the most recent Mortgage that was taken out on this home.
Original Mortgage
$208,000
Interest Rate
5.78%
Mortgage Type
Purchase Money Mortgage
Create a Home Valuation Report for This Property
The Home Valuation Report is an in-depth analysis detailing your home's value as well as a comparison with similar homes in the area
Home Values in the Area
Average Home Value in this Area
Purchase History
| Date | Buyer | Sale Price | Title Company |
|---|---|---|---|
| Mendonca John | $209,000 | -- | |
| Mendonca John | $209,000 | -- | |
| Morrissey 3Rd Gerald A | $260,000 | -- | |
| Morrissey 3Rd Gerald A | $260,000 | -- |
Source: Public Records
Mortgage History
| Date | Status | Borrower | Loan Amount |
|---|---|---|---|
| Open | Mendonca John | $205,214 | |
| Closed | Mendonca John | $205,214 | |
| Previous Owner | Morrissey 3Rd Gerald A | $208,000 | |
| Previous Owner | Morrissey 3Rd Gerald A | $39,000 | |
| Previous Owner | Morrissey 3Rd Gerald A | $60,000 |
Source: Public Records
Tax History Compared to Growth
Tax History
| Year | Tax Paid | Tax Assessment Tax Assessment Total Assessment is a certain percentage of the fair market value that is determined by local assessors to be the total taxable value of land and additions on the property. | Land | Improvement |
|---|---|---|---|---|
| 2025 | $4,933 | $436,200 | $89,500 | $346,700 |
| 2024 | $4,888 | $407,300 | $76,400 | $330,900 |
| 2023 | $4,856 | $339,800 | $64,000 | $275,800 |
| 2022 | $4,347 | $279,700 | $58,500 | $221,200 |
| 2021 | $4,136 | $265,300 | $58,500 | $206,800 |
| 2020 | $4,156 | $257,200 | $58,500 | $198,700 |
| 2019 | $3,930 | $238,600 | $58,500 | $180,100 |
| 2018 | $3,635 | $218,600 | $58,500 | $160,100 |
| 2017 | $3,502 | $209,800 | $58,500 | $151,300 |
| 2016 | $3,357 | $203,600 | $58,500 | $145,100 |
| 2015 | $3,146 | $200,000 | $58,500 | $141,500 |
| 2014 | $3,237 | $213,500 | $58,500 | $155,000 |
Source: Public Records
Map
Nearby Homes