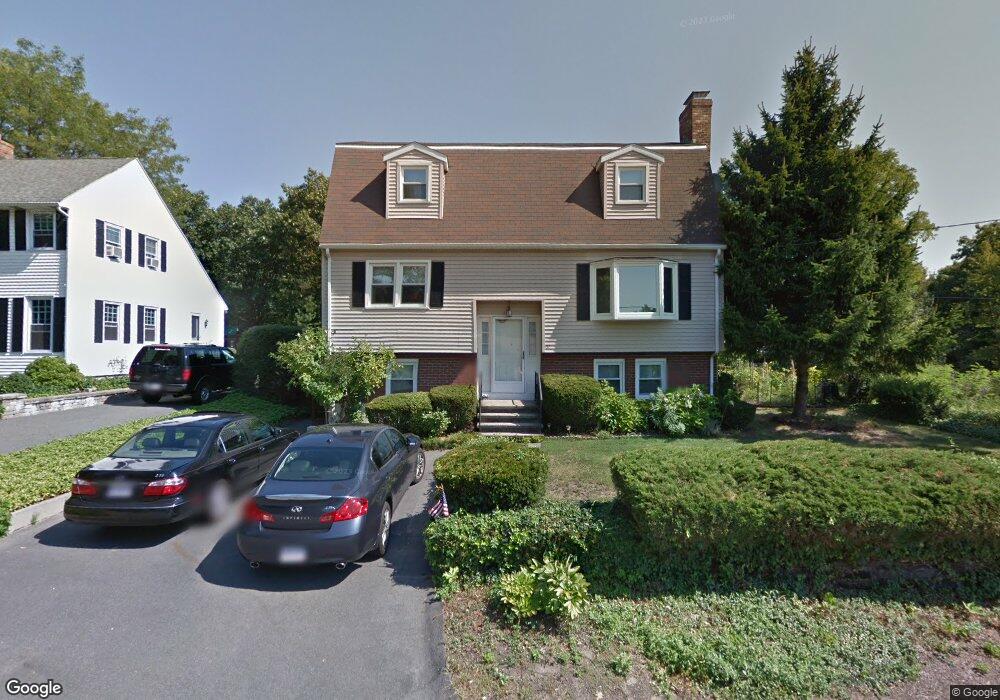
67 Woodland S Lynn, MA 01904
Lynn Woods NeighborhoodEstimated Value: $651,000 - $931,000
3
Beds
3
Baths
1,786
Sq Ft
$410/Sq Ft
Est. Value
About This Home
This home is located at 67 Woodland S, Lynn, MA 01904 and is currently estimated at $731,537, approximately $409 per square foot. 67 Woodland S is a home located in Essex County with nearby schools including Lynn Woods Elementary School, William R. Fallon School, and Pickering Middle School.
Ownership History
Date
Name
Owned For
Owner Type
Purchase Details
Closed on
Sep 27, 2024
Sold by
Paragios Kostas and Paragios Paula
Bought by
Paragios Ret Ft and Paragios
Current Estimated Value
Purchase Details
Closed on
Dec 12, 1988
Sold by
Kotowski Edward J
Bought by
Paragios Kostas
Home Financials for this Owner
Home Financials are based on the most recent Mortgage that was taken out on this home.
Original Mortgage
$162,750
Interest Rate
10.17%
Mortgage Type
Purchase Money Mortgage
Create a Home Valuation Report for This Property
The Home Valuation Report is an in-depth analysis detailing your home's value as well as a comparison with similar homes in the area
Home Values in the Area
Average Home Value in this Area
Purchase History
| Date | Buyer | Sale Price | Title Company |
|---|---|---|---|
| Paragios Ret Ft | -- | None Available | |
| Paragios Ret Ft | -- | None Available | |
| Paragios Ret Ft | -- | None Available | |
| Paragios Kostas | $217,000 | -- |
Source: Public Records
Mortgage History
| Date | Status | Borrower | Loan Amount |
|---|---|---|---|
| Previous Owner | Paragios Kostas | $126,000 | |
| Previous Owner | Paragios Kostas | $162,750 | |
| Previous Owner | Paragios Kostas | $135,000 |
Source: Public Records
Tax History Compared to Growth
Tax History
| Year | Tax Paid | Tax Assessment Tax Assessment Total Assessment is a certain percentage of the fair market value that is determined by local assessors to be the total taxable value of land and additions on the property. | Land | Improvement |
|---|---|---|---|---|
| 2025 | $5,516 | $532,400 | $198,500 | $333,900 |
| 2024 | $5,921 | $562,300 | $190,300 | $372,000 |
| 2023 | $5,257 | $471,500 | $211,900 | $259,600 |
| 2022 | $5,066 | $407,600 | $153,500 | $254,100 |
| 2021 | $5,323 | $408,500 | $147,900 | $260,600 |
| 2020 | $5,408 | $403,600 | $139,700 | $263,900 |
| 2019 | $5,526 | $386,400 | $117,600 | $268,800 |
| 2018 | $5,719 | $377,500 | $141,400 | $236,100 |
| 2017 | $5,385 | $345,200 | $131,900 | $213,300 |
| 2016 | $5,255 | $324,800 | $122,800 | $202,000 |
| 2015 | $5,117 | $305,500 | $121,500 | $184,000 |
Source: Public Records
Map
Nearby Homes