67 Yvonne Cir Flintstone, GA 30725
Flintstone NeighborhoodEstimated Value: $198,694 - $247,000
--
Bed
2
Baths
1,260
Sq Ft
$178/Sq Ft
Est. Value
About This Home
This home is located at 67 Yvonne Cir, Flintstone, GA 30725 and is currently estimated at $224,424, approximately $178 per square foot. 67 Yvonne Cir is a home located in Walker County with nearby schools including Chattanooga Valley Elementary School, Chattanooga Valley Middle School, and Ridgeland High School.
Ownership History
Date
Name
Owned For
Owner Type
Purchase Details
Closed on
Aug 6, 2020
Sold by
Stegel Damon
Bought by
Epperson Damon Bradley and Epperson Rachele
Current Estimated Value
Purchase Details
Closed on
Sep 8, 2008
Sold by
Not Provided
Bought by
Stegel Damon
Purchase Details
Closed on
Sep 26, 1994
Sold by
Stodghill James S and Stodghill Jacquelin
Bought by
Lynde Francis H and Lynde Charles C
Purchase Details
Closed on
Aug 16, 1991
Sold by
Smith Gregory B and Smith Leeanne
Bought by
Stodghill James S and Stodghill Jacquelin
Purchase Details
Closed on
Sep 30, 1985
Sold by
Carpenter Manar L
Bought by
Smith Gregory B and Smith Leeanne
Purchase Details
Closed on
Feb 16, 1981
Sold by
Dobson Cheryl E
Bought by
Carpenter Manar L
Purchase Details
Closed on
Nov 22, 1979
Sold by
Dobson James S and Dobson Cheryl
Bought by
Dobson Cheryl E
Purchase Details
Closed on
Aug 22, 1977
Sold by
Young Earnest P and Young Pauline L
Bought by
Dobson James S and Dobson Cheryl
Purchase Details
Closed on
Nov 19, 1971
Bought by
Young Earnest P and Young Pauline L
Create a Home Valuation Report for This Property
The Home Valuation Report is an in-depth analysis detailing your home's value as well as a comparison with similar homes in the area
Home Values in the Area
Average Home Value in this Area
Purchase History
| Date | Buyer | Sale Price | Title Company |
|---|---|---|---|
| Epperson Damon Bradley | $20,000 | -- | |
| Stegel Damon | -- | -- | |
| Stegel Damen | -- | -- | |
| Lynde Francis H | $58,500 | -- | |
| Stodghill James S | $54,000 | -- | |
| Smith Gregory B | $46,200 | -- | |
| Carpenter Manar L | $34,500 | -- | |
| Dobson Cheryl E | -- | -- | |
| Dobson James S | -- | -- | |
| Young Earnest P | -- | -- |
Source: Public Records
Tax History Compared to Growth
Tax History
| Year | Tax Paid | Tax Assessment Tax Assessment Total Assessment is a certain percentage of the fair market value that is determined by local assessors to be the total taxable value of land and additions on the property. | Land | Improvement |
|---|---|---|---|---|
| 2024 | $1,698 | $74,940 | $5,080 | $69,860 |
| 2023 | $1,657 | $71,481 | $5,080 | $66,401 |
| 2022 | $1,578 | $62,479 | $5,080 | $57,399 |
| 2021 | $1,310 | $46,058 | $5,080 | $40,978 |
| 2020 | $1,201 | $40,280 | $5,080 | $35,200 |
| 2019 | $1,223 | $40,280 | $5,080 | $35,200 |
| 2018 | $1,066 | $40,280 | $5,080 | $35,200 |
| 2017 | $1,333 | $40,280 | $5,080 | $35,200 |
| 2016 | $1,116 | $40,280 | $5,080 | $35,200 |
| 2015 | $1,162 | $39,640 | $6,000 | $33,640 |
| 2014 | $1,065 | $39,640 | $6,000 | $33,640 |
| 2013 | -- | $39,640 | $6,000 | $33,640 |
Source: Public Records
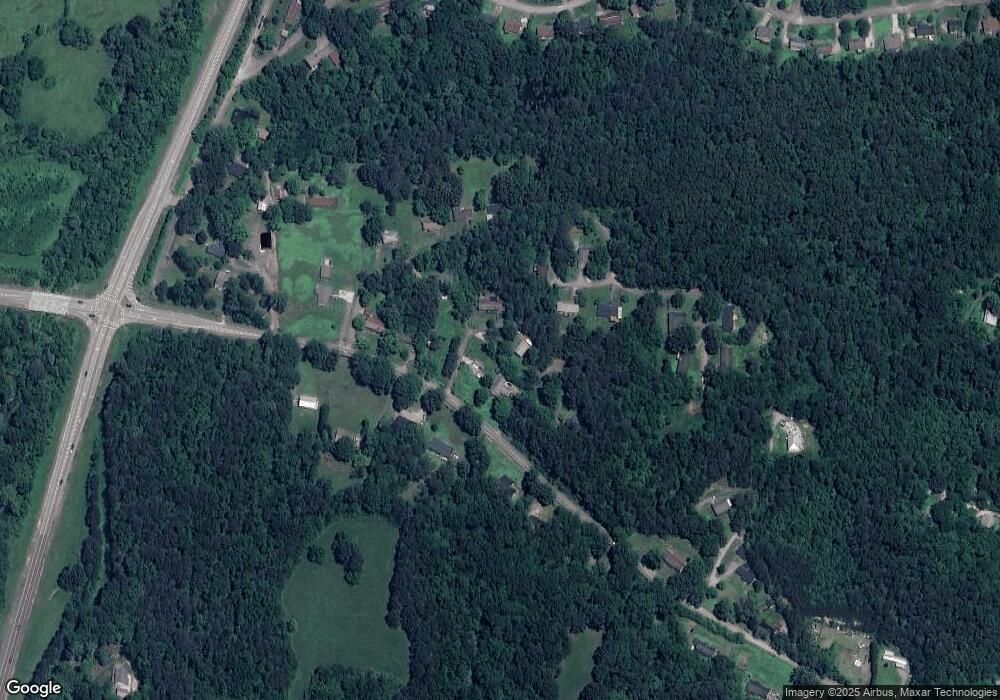
Map
Nearby Homes
- 4302 Happy Valley Rd
- 184 Cinderella Dr
- 569 Tinker Bell Cir
- 113 Fox Run Cir N
- 137 Fox Run Cir N
- 76 Saddlebred Way
- 4766 Happy Valley Rd
- 18 Buck Creek Ln
- 278 Dry Valley Rd
- 880 Dry Valley Rd
- 306 Dry Valley Rd
- 114 Saddlebred Way
- 0 Dry Valley Rd Unit 1507680
- 34 And 38 East Ave
- 3438 East Ave
- 89 Oak Ct
- 2937 Happy Valley Rd
- 1308 Dry Valley Rd
- 242 Cascade Dr
- 256 Cascade Dr
- 27 Yvonne Cir
- 113 Yvonne Cir
- 92 Yvonne Cir
- 30 Yvonne Cir
- 228 Hill Top Cir
- 224 Hill Top Cir
- 240 Hill Top Cir
- 0 Happy Valley Rd
- 4247 Happy Valley Rd
- 214 Hill Top Cir
- 4283 Happy Valley Rd
- 4283 Happy Valley Rd Unit 1
- 296 Hill Top Cir
- 0 Hill Top Cir Unit 20927143
- 0 Hill Top Cir Unit 1501416
- 0 Hill Top Cir Unit 1388510
- 0 Hill Top Cir Unit 10344396
- 0 Hill Top Cir
- 4229 Happy Valley Rd
- 4229 Happy Valley Rd