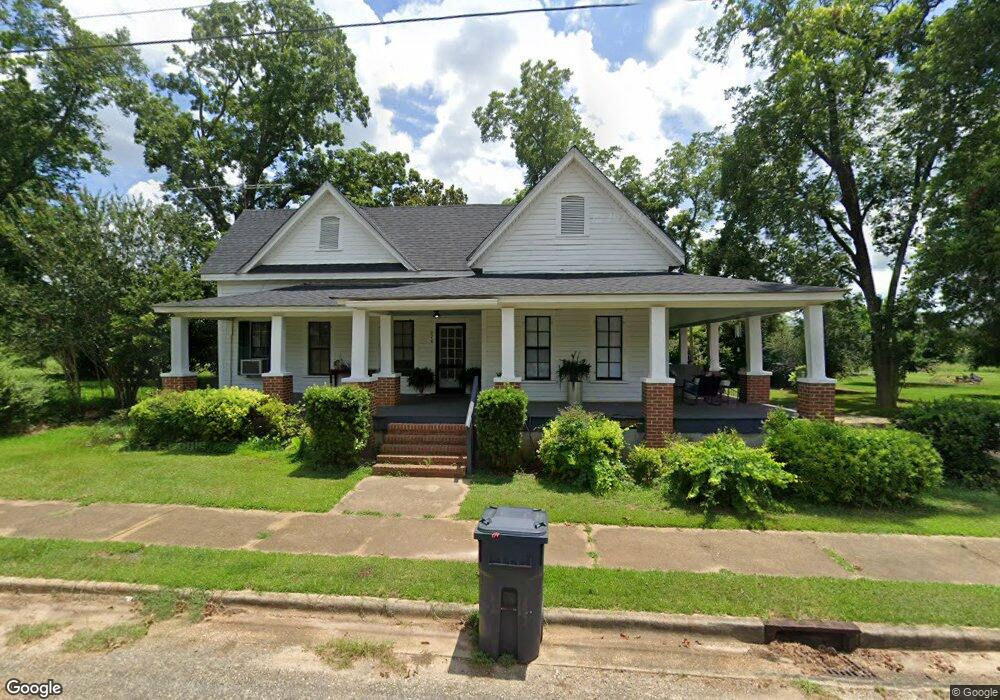
670 Carnegie Rd Coleman, GA 39836
Estimated Value: $73,313 - $245,000
3
Beds
1
Bath
1,644
Sq Ft
$105/Sq Ft
Est. Value
About This Home
This home is located at 670 Carnegie Rd, Coleman, GA 39836 and is currently estimated at $172,328, approximately $104 per square foot. 670 Carnegie Rd is a home located in Randolph County with nearby schools including Randolph County Elementary School, Randolph Clay Middle School, and Randolph Clay High School.
Ownership History
Date
Name
Owned For
Owner Type
Purchase Details
Closed on
Mar 20, 2024
Sold by
Nichols Family Farm Llc
Bought by
Nichols Peggy A and Nichols Peggy C
Current Estimated Value
Purchase Details
Closed on
Feb 20, 2024
Sold by
Nichols Family Farm Llc
Bought by
Nichols Peggy A
Create a Home Valuation Report for This Property
The Home Valuation Report is an in-depth analysis detailing your home's value as well as a comparison with similar homes in the area
Home Values in the Area
Average Home Value in this Area
Purchase History
| Date | Buyer | Sale Price | Title Company |
|---|---|---|---|
| Nichols Peggy A | -- | -- | |
| Nichols Peggy A | -- | -- | |
| Nichols Family Farm Llc | -- | -- |
Source: Public Records
Tax History Compared to Growth
Tax History
| Year | Tax Paid | Tax Assessment Tax Assessment Total Assessment is a certain percentage of the fair market value that is determined by local assessors to be the total taxable value of land and additions on the property. | Land | Improvement |
|---|---|---|---|---|
| 2024 | $1,069 | $24,400 | $1,764 | $22,636 |
| 2023 | $919 | $24,400 | $1,764 | $22,636 |
| 2022 | $960 | $27,120 | $1,960 | $25,160 |
| 2021 | $580 | $16,146 | $1,988 | $14,158 |
| 2020 | $597 | $16,146 | $1,988 | $14,158 |
| 2019 | $595 | $16,146 | $1,988 | $14,158 |
| 2018 | $739 | $20,943 | $1,988 | $18,955 |
| 2017 | $577 | $16,289 | $1,988 | $14,301 |
| 2016 | $579 | $16,289 | $1,988 | $14,301 |
| 2015 | -- | $16,289 | $1,988 | $14,301 |
| 2014 | -- | $16,289 | $1,988 | $14,301 |
| 2013 | -- | $16,288 | $1,987 | $14,301 |
Source: Public Records
Map
Nearby Homes
- County Line Rd Lot Unit WP001
- 0 County Rd 70
- 223 Deer Run Rd
- 0 Fountain Bridge Rd
- 24346 U S 27
- 24333 U S 27
- 203 Wayback Rd
- 5 Pine St
- 1 Pine St
- 4 Pine St
- 0 Pine St
- 1626 Pine St
- 229 +-ac Cty Rd 62 Cty Rd 160 (Morgan Rd)
- 2700 Silo Rd
- Pine St NW
- 464 Bay Ave NE
- 19468 Hartford St E
- 3016 Clubhouse Rd
- 2236 County Road 150
- Home Place
- 664 Carnegie Rd
- 673 Carnegie Rd
- 660 Carnegie Rd
- 681 Carnegie Rd
- 684 Carnegie Rd
- 463 Georgia 216
- 79 Depot Rd
- 666 Ga Highway 216
- 29 Eleven Bridges Rd
- 36 Eleven Bridges Rd
- 97 Depot Rd
- 216 Ga
- 9 Mckinnon St
- 426 Ga Highway 216
- 426 Ga Highway 216
- 22 Mckinnon St
- 633 Ga Highway 216
- 87 Depot Rd
- 8 Mckinnon St
- 0 Mckinnon St