670 Curk Roberts Rd Braselton, GA 30517
Estimated Value: $171,000 - $635,000
--
Bed
1
Bath
1,020
Sq Ft
$328/Sq Ft
Est. Value
About This Home
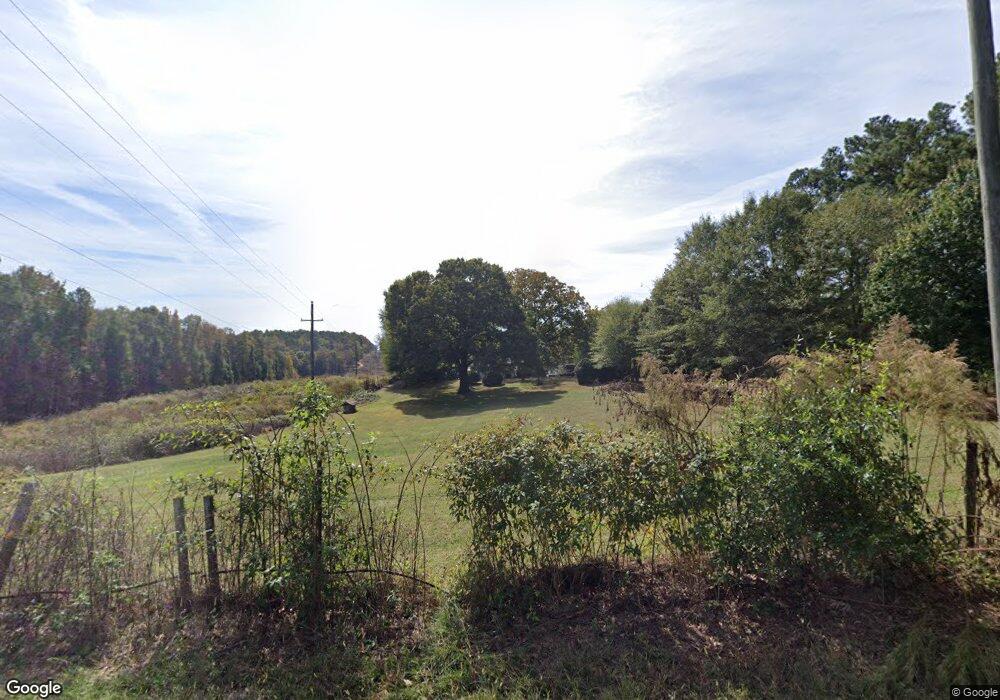
This home is located at 670 Curk Roberts Rd, Braselton, GA 30517 and is currently estimated at $335,001, approximately $328 per square foot. 670 Curk Roberts Rd is a home located in Jackson County with nearby schools including West Jackson Elementary School, West Jackson Middle School, and Jackson County High School.
Ownership History
Date
Name
Owned For
Owner Type
Purchase Details
Closed on
Nov 26, 2024
Sold by
Gooch Wendell
Bought by
Gooch Wendell
Current Estimated Value
Purchase Details
Closed on
Mar 18, 2023
Sold by
Gooch Wendell
Bought by
W And W Trust
Purchase Details
Closed on
Apr 15, 2005
Sold by
Livingston Holley
Bought by
Gooch Wendell
Home Financials for this Owner
Home Financials are based on the most recent Mortgage that was taken out on this home.
Original Mortgage
$71,000
Interest Rate
5.88%
Mortgage Type
New Conventional
Purchase Details
Closed on
Nov 1, 2004
Sold by
Ronnie Scroggs Construction In
Bought by
Livingston Holley
Purchase Details
Closed on
Sep 30, 2004
Sold by
Wofford Myra B
Bought by
Ronnie Scroggs Construction Inc
Purchase Details
Closed on
Aug 8, 2000
Sold by
Wofford Myra M and Wofford Jam
Bought by
Wofford Myra B
Purchase Details
Closed on
Oct 23, 1998
Sold by
Roberts Julian
Bought by
Wofford Myra M and Wofford Jam
Create a Home Valuation Report for This Property
The Home Valuation Report is an in-depth analysis detailing your home's value as well as a comparison with similar homes in the area
Home Values in the Area
Average Home Value in this Area
Purchase History
| Date | Buyer | Sale Price | Title Company |
|---|---|---|---|
| Gooch Wendell | -- | -- | |
| W And W Trust | -- | -- | |
| Gooch Wendell | $71,000 | -- | |
| Livingston Holley | $45,000 | -- | |
| Livingston Holley | $45,000 | -- | |
| Ronnie Scroggs Construction Inc | $30,000 | -- | |
| Wofford Myra B | -- | -- | |
| Wofford Myra M | $30,000 | -- |
Source: Public Records
Mortgage History
| Date | Status | Borrower | Loan Amount |
|---|---|---|---|
| Previous Owner | Gooch Wendell | $71,000 |
Source: Public Records
Tax History Compared to Growth
Tax History
| Year | Tax Paid | Tax Assessment Tax Assessment Total Assessment is a certain percentage of the fair market value that is determined by local assessors to be the total taxable value of land and additions on the property. | Land | Improvement |
|---|---|---|---|---|
| 2024 | $1,127 | $74,640 | $50,040 | $24,600 |
| 2023 | $1,127 | $71,160 | $50,040 | $21,120 |
| 2022 | $976 | $33,600 | $17,000 | $16,600 |
| 2021 | $982 | $33,600 | $17,000 | $16,600 |
| 2020 | $943 | $29,840 | $17,000 | $12,840 |
| 2019 | $956 | $29,840 | $17,000 | $12,840 |
| 2018 | $947 | $29,200 | $17,000 | $12,200 |
| 2017 | $868 | $26,741 | $15,321 | $11,420 |
| 2016 | $872 | $26,741 | $15,321 | $11,420 |
| 2015 | $876 | $26,741 | $15,321 | $11,420 |
| 2014 | $761 | $23,934 | $15,321 | $8,614 |
| 2013 | -- | $23,934 | $15,320 | $8,613 |
Source: Public Records
Map
Nearby Homes
- 5068 Highway 53
- 53 Ednaville Rd
- 6647 Hwy 53
- 6647 Highway 53
- 532 Davenport Rd
- 21 Duck Rd
- 1316 Sunny Valley Ln
- 1390 Sunny Valley Ln
- 1406 Sunny Valley Ln
- 1420 Sunny Valley Ln
- 1359 Sunny Valley Ln
- 1450 Sunny Valley Ln
- 1385 Sunny Valley Ln
- 1415 Sunny Valley Ln
- 0 Davenport Rd Unit 10583908
- 0 Davenport Rd Unit 16748330
- 140 Lott Creek Ct
- 1092 Sunny Valley Ln
- 377 Hellen Valley Dr
- 656 Curk Roberts Rd
- 656 Curk Roberts Rd
- 620 Curk Roberts Rd
- 620 Curk Roberts Rd Unit 118-008A,A1,A2,A3
- 594 Curk Roberts Rd
- 783 Curk Roberts Rd
- 649 Curk Roberts Rd
- 49 Viper Ln
- 625 Curk Roberts Rd
- 543 Curk Roberts Rd
- 98 Viper Ln
- 510 Curk Roberts Rd
- 0 Viper Ln Unit 7195965
- 0 Viper Ln
- 477 Curk Roberts Rd
- 0 Highway 124 W Unit 2697715
- 0 Highway 124 W Unit 8997683
- 0 Highway 124 W Unit 8543079
- 44 Viper Ln
- 7148 Highway 53