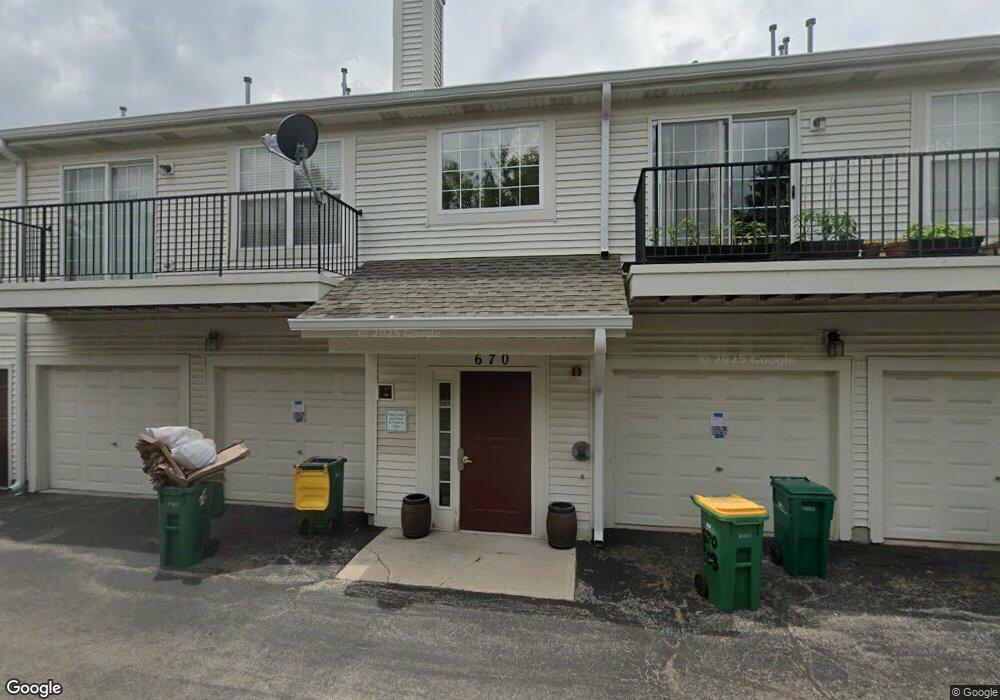
670 Mill Cir Unit 1335 Wheeling, IL 60090
Estimated Value: $254,826 - $295,000
2
Beds
2
Baths
1,050
Sq Ft
$266/Sq Ft
Est. Value
About This Home
This home is located at 670 Mill Cir Unit 1335, Wheeling, IL 60090 and is currently estimated at $278,957, approximately $265 per square foot. 670 Mill Cir Unit 1335 is a home located in Cook County with nearby schools including Walt Whitman Elementary School, Oliver W Holmes Middle School, and Wheeling High School.
Ownership History
Date
Name
Owned For
Owner Type
Purchase Details
Closed on
Apr 3, 2023
Sold by
Park Chin
Bought by
Stolyarov Max
Current Estimated Value
Purchase Details
Closed on
Oct 16, 2013
Sold by
Fannie Mae
Bought by
Park Chin
Home Financials for this Owner
Home Financials are based on the most recent Mortgage that was taken out on this home.
Original Mortgage
$116,000
Interest Rate
4.75%
Mortgage Type
New Conventional
Purchase Details
Closed on
Jul 17, 2013
Sold by
Superson
Bought by
Federal National Mortgage Association
Purchase Details
Closed on
May 31, 2005
Sold by
Farr John C and Farr Halina
Bought by
Superson Danuta
Home Financials for this Owner
Home Financials are based on the most recent Mortgage that was taken out on this home.
Original Mortgage
$191,200
Interest Rate
6.25%
Mortgage Type
Fannie Mae Freddie Mac
Purchase Details
Closed on
May 9, 2002
Sold by
River Mill Wheeling L L C
Bought by
Farr John C and Farr Halina
Create a Home Valuation Report for This Property
The Home Valuation Report is an in-depth analysis detailing your home's value as well as a comparison with similar homes in the area
Home Values in the Area
Average Home Value in this Area
Purchase History
| Date | Buyer | Sale Price | Title Company |
|---|---|---|---|
| Stolyarov Max | $225,000 | Fidelity National Title | |
| Park Chin | $129,000 | Attorneys Title Guaranty Fun | |
| Federal National Mortgage Association | -- | None Available | |
| Superson Danuta | $239,000 | Multiple | |
| Farr John C | $168,500 | 1St American Title |
Source: Public Records
Mortgage History
| Date | Status | Borrower | Loan Amount |
|---|---|---|---|
| Previous Owner | Park Chin | $116,000 | |
| Previous Owner | Superson Danuta | $191,200 |
Source: Public Records
Tax History Compared to Growth
Tax History
| Year | Tax Paid | Tax Assessment Tax Assessment Total Assessment is a certain percentage of the fair market value that is determined by local assessors to be the total taxable value of land and additions on the property. | Land | Improvement |
|---|---|---|---|---|
| 2024 | $4,292 | $16,123 | $2,211 | $13,912 |
| 2023 | $4,059 | $16,123 | $2,211 | $13,912 |
| 2022 | $4,059 | $16,123 | $2,211 | $13,912 |
| 2021 | $3,751 | $13,455 | $381 | $13,074 |
| 2020 | $3,736 | $13,455 | $381 | $13,074 |
| 2019 | $3,826 | $15,107 | $381 | $14,726 |
| 2018 | $3,098 | $11,925 | $304 | $11,621 |
| 2017 | $3,057 | $11,925 | $304 | $11,621 |
| 2016 | $3,145 | $11,925 | $304 | $11,621 |
| 2015 | $2,219 | $8,851 | $1,295 | $7,556 |
| 2014 | $3,077 | $8,851 | $1,295 | $7,556 |
| 2013 | $1,997 | $8,851 | $1,295 | $7,556 |
Source: Public Records
Map
Nearby Homes
- 716 River Mill Pkwy Unit 204
- 728 River Walk Dr Unit 75
- 754 River Walk Dr
- 475 Plum Creek Dr Unit 206
- 511 Prestwick Ln Unit 402
- 375 Plum Creek Dr Unit 501
- 350 Plum Creek Dr Unit 206
- 452 Hickory Dr
- 241 S Milwaukee Ave
- 121 Commons Ct Unit 21
- 148 Wheeling Ave
- 1033 Wheeling Rd
- 115 E Dundee Rd Unit 3N
- 70 Center Ave
- 4211 Timberlane Dr
- 190 N Milwaukee Ave Unit 3604
- 321 Forestway Ln Unit 3B
- 200 Violet Ln
- 127 N Wolf Rd Unit 53B
- 3969 Maple Ave
- 670 Mill Cir Unit 305
- 670 Mill Cir Unit 1324
- 670 Mill Cir Unit 1323
- 670 Mill Cir Unit 1313
- 670 Mill Cir Unit 1311
- 670 Mill Cir Unit 1333
- 670 Mill Cir Unit 1325
- 670 Mill Cir Unit 1317
- 670 Mill Cir Unit 1315
- 670 Mill Cir Unit 1326
- 670 Mill Cir Unit 3005
- 670 Mill Cir Unit 303
- 670 Mill Cir Unit 205
- 670 Mill Cir Unit 105
- 670 Mill Cir Unit 103
- 660 Mill Cir Unit 206
- 660 Mill Cir Unit 203
- 660 Mill Cir Unit 303
- 660 Mill Cir Unit 1224
- 660 Mill Cir Unit 1213