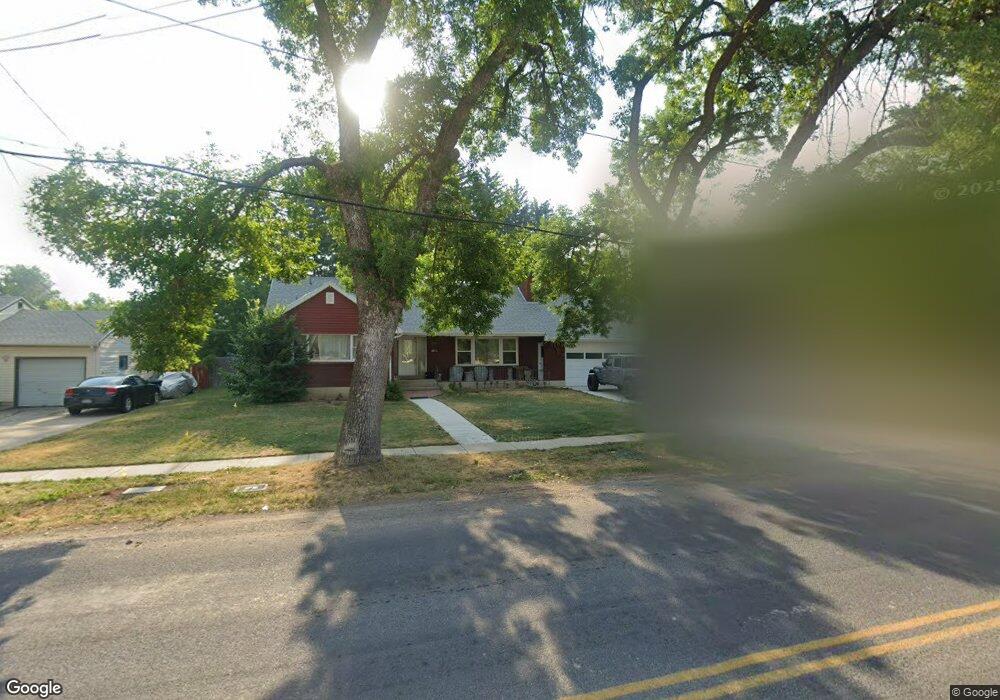
670 N 200 W Logan, UT 84321
Bridger NeighborhoodEstimated Value: $423,000 - $448,000
4
Beds
3
Baths
3,122
Sq Ft
$140/Sq Ft
Est. Value
About This Home
This home is located at 670 N 200 W, Logan, UT 84321 and is currently estimated at $436,290, approximately $139 per square foot. 670 N 200 W is a home located in Cache County with nearby schools including Bridger School, Mount Logan Middle School, and Logan High School.
Ownership History
Date
Name
Owned For
Owner Type
Purchase Details
Closed on
May 28, 2010
Sold by
Hansen Michael S and Hansen Elizabeth M
Bought by
Nolasco William R and Nolasco Maribel
Current Estimated Value
Home Financials for this Owner
Home Financials are based on the most recent Mortgage that was taken out on this home.
Original Mortgage
$186,459
Outstanding Balance
$126,443
Interest Rate
5.37%
Mortgage Type
FHA
Estimated Equity
$309,847
Purchase Details
Closed on
Jul 10, 2007
Sold by
Jarvis Floyd A and Jarvis Ella M
Bought by
Hansen Michael S and Hansen Elizabeth M
Home Financials for this Owner
Home Financials are based on the most recent Mortgage that was taken out on this home.
Original Mortgage
$192,479
Interest Rate
6.73%
Mortgage Type
FHA
Create a Home Valuation Report for This Property
The Home Valuation Report is an in-depth analysis detailing your home's value as well as a comparison with similar homes in the area
Home Values in the Area
Average Home Value in this Area
Purchase History
| Date | Buyer | Sale Price | Title Company |
|---|---|---|---|
| Nolasco William R | -- | Cache Title Company | |
| Hansen Michael S | -- | Hickman Land Title Company |
Source: Public Records
Mortgage History
| Date | Status | Borrower | Loan Amount |
|---|---|---|---|
| Open | Nolasco William R | $186,459 | |
| Previous Owner | Hansen Michael S | $192,479 |
Source: Public Records
Tax History Compared to Growth
Tax History
| Year | Tax Paid | Tax Assessment Tax Assessment Total Assessment is a certain percentage of the fair market value that is determined by local assessors to be the total taxable value of land and additions on the property. | Land | Improvement |
|---|---|---|---|---|
| 2025 | $1,780 | $230,205 | $0 | $0 |
| 2024 | $1,838 | $230,205 | $0 | $0 |
| 2023 | $1,919 | $229,150 | $0 | $0 |
| 2022 | $2,055 | $229,150 | $0 | $0 |
| 2021 | $1,637 | $282,010 | $44,500 | $237,510 |
| 2020 | $1,466 | $227,200 | $44,500 | $182,700 |
| 2019 | $1,532 | $227,200 | $44,500 | $182,700 |
| 2018 | $1,484 | $200,964 | $44,500 | $156,464 |
| 2017 | $1,415 | $101,310 | $0 | $0 |
| 2016 | $1,467 | $95,810 | $0 | $0 |
| 2015 | $1,389 | $95,810 | $0 | $0 |
| 2014 | $1,255 | $95,810 | $0 | $0 |
| 2013 | -- | $94,990 | $0 | $0 |
Source: Public Records
Map
Nearby Homes