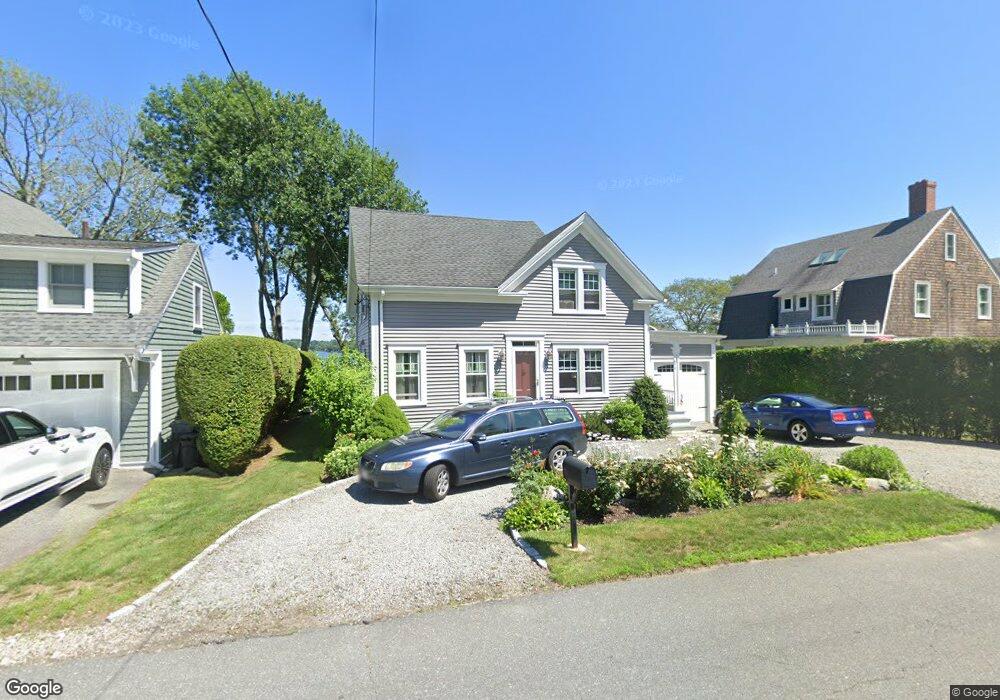
670 Pearse Rd Swansea, MA 02777
Touisset NeighborhoodEstimated Value: $585,730 - $835,000
4
Beds
1
Bath
1,581
Sq Ft
$440/Sq Ft
Est. Value
About This Home
This home is located at 670 Pearse Rd, Swansea, MA 02777 and is currently estimated at $695,433, approximately $439 per square foot. 670 Pearse Rd is a home located in Bristol County with nearby schools including Joseph Case High School and East Bay Career Academy.
Ownership History
Date
Name
Owned For
Owner Type
Purchase Details
Closed on
May 24, 2013
Sold by
Route 6 Lumber Llc
Bought by
Dubuc Robert H and Dubuc Janet R
Current Estimated Value
Home Financials for this Owner
Home Financials are based on the most recent Mortgage that was taken out on this home.
Original Mortgage
$319,000
Outstanding Balance
$225,741
Interest Rate
3.45%
Mortgage Type
New Conventional
Estimated Equity
$469,692
Purchase Details
Closed on
Oct 17, 2011
Sold by
Butchaman Gillian
Bought by
Route 61 Umber Llc
Purchase Details
Closed on
Oct 5, 2009
Sold by
Lamb John
Bought by
Butchman Gillian and Schwarz Janet
Create a Home Valuation Report for This Property
The Home Valuation Report is an in-depth analysis detailing your home's value as well as a comparison with similar homes in the area
Home Values in the Area
Average Home Value in this Area
Purchase History
| Date | Buyer | Sale Price | Title Company |
|---|---|---|---|
| Dubuc Robert H | $369,000 | -- | |
| Route 61 Umber Llc | $300,000 | -- | |
| Butchman Gillian | -- | -- |
Source: Public Records
Mortgage History
| Date | Status | Borrower | Loan Amount |
|---|---|---|---|
| Open | Dubuc Robert H | $319,000 |
Source: Public Records
Tax History Compared to Growth
Tax History
| Year | Tax Paid | Tax Assessment Tax Assessment Total Assessment is a certain percentage of the fair market value that is determined by local assessors to be the total taxable value of land and additions on the property. | Land | Improvement |
|---|---|---|---|---|
| 2025 | $7,259 | $609,000 | $309,000 | $300,000 |
| 2024 | $7,272 | $606,500 | $308,500 | $298,000 |
| 2023 | $6,739 | $513,271 | $249,171 | $264,100 |
| 2022 | $5,689 | $395,362 | $192,962 | $202,400 |
| 2021 | $6,041 | $386,506 | $204,706 | $181,800 |
| 2020 | $6,022 | $386,500 | $204,700 | $181,800 |
| 2019 | $5,926 | $382,100 | $187,600 | $194,500 |
| 2018 | $5,779 | $378,200 | $193,900 | $184,300 |
| 2017 | $5,275 | $397,200 | $208,800 | $188,400 |
| 2016 | $4,874 | $360,500 | $207,600 | $152,900 |
| 2015 | $4,707 | $358,500 | $207,600 | $150,900 |
| 2014 | $4,625 | $360,200 | $207,600 | $152,600 |
Source: Public Records
Map
Nearby Homes
- 25 Inverness Rd
- 110 Seaview Ave
- 95 Winslow Way
- 502 Ocean Grove Ave
- 153 Puffer Ave
- 34 Columbia Rd
- 20 Sherbourne Ave
- 105 Birchwood Dr
- 447 Old Warren Rd
- 79 Cedar Ave
- 41 James Ave
- 0 Barton Ave
- 196 Coolidge St
- 9 Kenny Dr
- 123 Calef Ave
- 17 Colonial Dr
- 159 Wilder St
- 25 Asylum Rd
- 11 Stonegate Rd
- 46 Magnolia Dr