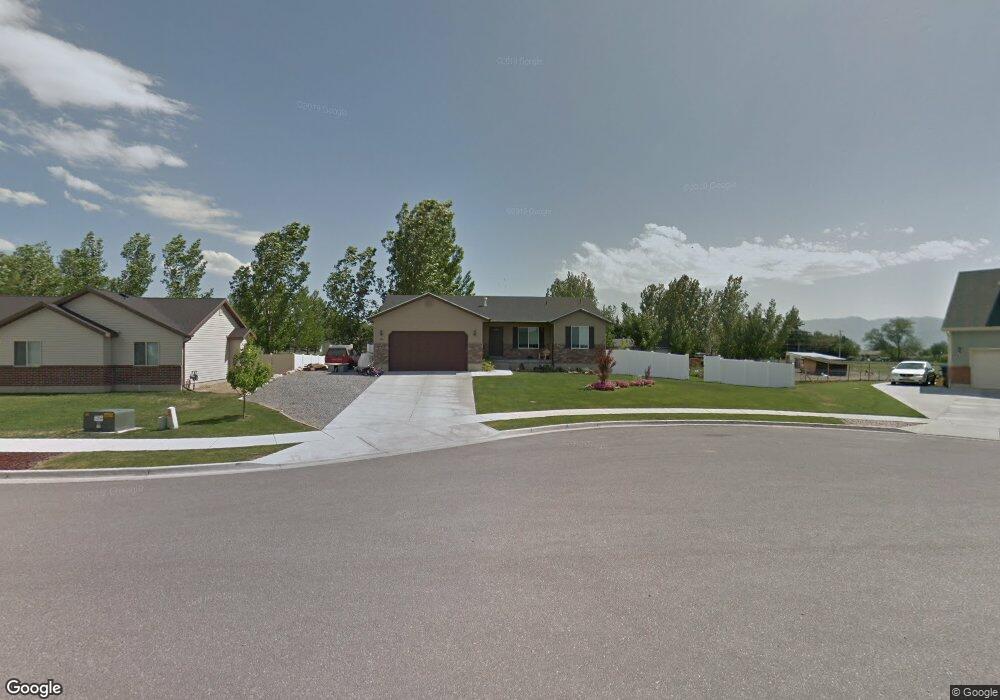
670 W 160 N Unit 7 Smithfield, UT 84335
Estimated Value: $479,697 - $498,000
--
Bed
--
Bath
1,260
Sq Ft
$387/Sq Ft
Est. Value
About This Home
This home is located at 670 W 160 N Unit 7, Smithfield, UT 84335 and is currently estimated at $487,674, approximately $387 per square foot. 670 W 160 N Unit 7 is a home located in Cache County with nearby schools including Birch Creek School, North Cache Middle School, and White Pine Middle School.
Ownership History
Date
Name
Owned For
Owner Type
Purchase Details
Closed on
Sep 25, 2009
Sold by
Atkinson Ryan
Bought by
Atkinson Ryan and Atkinson Dani Lanae
Current Estimated Value
Home Financials for this Owner
Home Financials are based on the most recent Mortgage that was taken out on this home.
Original Mortgage
$155,217
Outstanding Balance
$110,687
Interest Rate
5.25%
Mortgage Type
Purchase Money Mortgage
Estimated Equity
$376,987
Purchase Details
Closed on
Sep 11, 2009
Sold by
Acf Development Llc
Bought by
Neighborhood Nonprofit Housing Corporati
Home Financials for this Owner
Home Financials are based on the most recent Mortgage that was taken out on this home.
Original Mortgage
$155,217
Outstanding Balance
$110,687
Interest Rate
5.25%
Mortgage Type
Purchase Money Mortgage
Estimated Equity
$376,987
Create a Home Valuation Report for This Property
The Home Valuation Report is an in-depth analysis detailing your home's value as well as a comparison with similar homes in the area
Home Values in the Area
Average Home Value in this Area
Purchase History
| Date | Buyer | Sale Price | Title Company |
|---|---|---|---|
| Atkinson Ryan | -- | Cache Title Company | |
| Atkinson Ryan | -- | Cache Title Company | |
| Neighborhood Nonprofit Housing Corporati | -- | Cache Title Company |
Source: Public Records
Mortgage History
| Date | Status | Borrower | Loan Amount |
|---|---|---|---|
| Open | Atkinson Ryan | $155,217 |
Source: Public Records
Tax History Compared to Growth
Tax History
| Year | Tax Paid | Tax Assessment Tax Assessment Total Assessment is a certain percentage of the fair market value that is determined by local assessors to be the total taxable value of land and additions on the property. | Land | Improvement |
|---|---|---|---|---|
| 2025 | $1,881 | $251,770 | $0 | $0 |
| 2024 | $2,015 | $253,040 | $0 | $0 |
| 2023 | $2,108 | $250,415 | $0 | $0 |
| 2022 | $2,143 | $250,415 | $0 | $0 |
| 2021 | $1,657 | $295,850 | $70,000 | $225,850 |
| 2020 | $1,600 | $266,392 | $70,000 | $196,392 |
| 2019 | $1,521 | $241,392 | $45,000 | $196,392 |
| 2018 | $1,435 | $220,350 | $45,000 | $175,350 |
| 2017 | $1,390 | $116,600 | $0 | $0 |
| 2016 | $1,415 | $94,035 | $0 | $0 |
| 2015 | $1,146 | $94,035 | $0 | $0 |
| 2014 | $1,123 | $94,035 | $0 | $0 |
| 2013 | -- | $94,035 | $0 | $0 |
Source: Public Records
Map
Nearby Homes
- 669 W 575 N Unit 552
- 669 W 575 N
- 610 W 100 N Unit 18
- 581 W 230 N
- 517 W 260 N
- 353 N 770 W
- Hawthorn Townhomes Unit B Plan at Golden Forest - Golden Forest Townhomes
- Princeton Plan at Golden Forest - Golden Forest Single Family
- Fairview Plan at Golden Forest - Golden Forest Single Family
- Richmond Plan at Golden Forest - Golden Forest Single Family
- Ashland Plan at Golden Forest - Golden Forest Single Family
- Magnolia Plan at Golden Forest - Golden Forest Single Family
- Athens Plan at Golden Forest - Golden Forest Single Family
- Madison Plan at Golden Forest - Golden Forest Single Family
- Highland Plan at Golden Forest - Golden Forest Single Family
- Hawthorn Townhomes Unit A Plan at Golden Forest - Golden Forest Townhomes
- Ashton Townhome Plan at Golden Forest - Golden Forest Townhomes
- 698 N 650 W Unit 640
- 347 W Center St
- 75 N 300 W
- 654 W 160 N Unit 6
- 684 W 160 N Unit 8
- 684 W 160 N
- 638 W 160 N Unit 5
- 671 W 160 N
- 671 W 160 N Unit 10
- 655 W 160 N Unit 11
- 655 W 160 N
- 685 W 160 N Unit 9
- 685 W 160 N
- 639 W 160 N Unit 12
- 622 W 160 N
- 655 W 100 N
- 677 W 100 N
- 643 W 100 N
- 623 W 160 N Unit 13
- 608 W 160 N Unit 3
- 608 W 160 N
- 137 N 600 W Unit 2
- 137 N 600 W