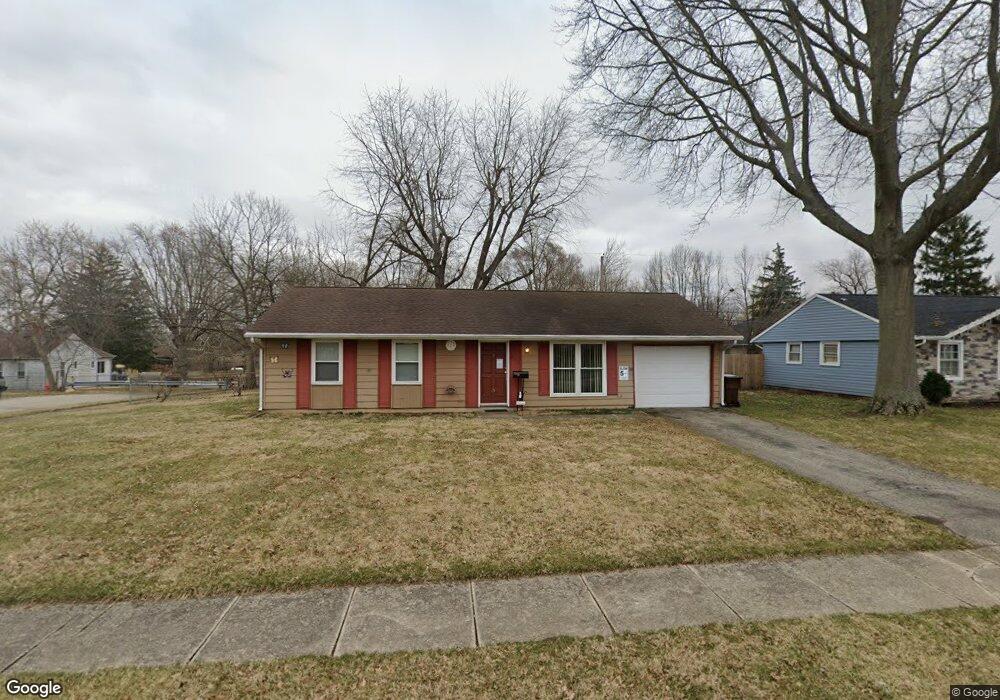
670 Winchester St New Carlisle, OH 45344
Estimated Value: $177,105 - $199,000
3
Beds
1
Bath
925
Sq Ft
$204/Sq Ft
Est. Value
About This Home
This home is located at 670 Winchester St, New Carlisle, OH 45344 and is currently estimated at $188,276, approximately $203 per square foot. 670 Winchester St is a home located in Clark County with nearby schools including Park Layne Elementary School, New Carlisle Elementary School, and Donnelsville Elementary School.
Ownership History
Date
Name
Owned For
Owner Type
Purchase Details
Closed on
Jul 16, 2008
Sold by
The Bank Of New York Trust Co Na
Bought by
Massing Shane L and Massing Donita L
Current Estimated Value
Purchase Details
Closed on
Mar 14, 2008
Sold by
Wilkinson Kent L and Wilkinson Gina R
Bought by
The Bank Of New York Trust Co Na and Jpmorgan Chase Bank Na
Purchase Details
Closed on
Aug 28, 2000
Sold by
Associates Home Equity Services Inc
Bought by
Wilkinson Kent L and Wilkinson Gina R
Home Financials for this Owner
Home Financials are based on the most recent Mortgage that was taken out on this home.
Original Mortgage
$55,000
Interest Rate
7.18%
Mortgage Type
Seller Take Back
Purchase Details
Closed on
Jun 27, 2000
Sold by
Sizemore Beverly A
Bought by
Associates Home Equity Services Inc
Create a Home Valuation Report for This Property
The Home Valuation Report is an in-depth analysis detailing your home's value as well as a comparison with similar homes in the area
Home Values in the Area
Average Home Value in this Area
Purchase History
| Date | Buyer | Sale Price | Title Company |
|---|---|---|---|
| Massing Shane L | $32,000 | Landcastle Title Llc | |
| The Bank Of New York Trust Co Na | $56,800 | Attorney | |
| Wilkinson Kent L | $55,000 | -- | |
| Associates Home Equity Services Inc | -- | Ohio Title |
Source: Public Records
Mortgage History
| Date | Status | Borrower | Loan Amount |
|---|---|---|---|
| Previous Owner | Wilkinson Kent L | $55,000 |
Source: Public Records
Tax History Compared to Growth
Tax History
| Year | Tax Paid | Tax Assessment Tax Assessment Total Assessment is a certain percentage of the fair market value that is determined by local assessors to be the total taxable value of land and additions on the property. | Land | Improvement |
|---|---|---|---|---|
| 2024 | $2,028 | $41,970 | $8,010 | $33,960 |
| 2023 | $2,028 | $41,970 | $8,010 | $33,960 |
| 2022 | $2,035 | $41,970 | $8,010 | $33,960 |
| 2021 | $1,505 | $28,180 | $6,110 | $22,070 |
| 2020 | $1,509 | $28,180 | $6,110 | $22,070 |
| 2019 | $1,529 | $28,180 | $6,110 | $22,070 |
| 2018 | $1,338 | $23,060 | $5,950 | $17,110 |
| 2017 | $1,330 | $22,250 | $5,947 | $16,303 |
| 2016 | $1,276 | $22,250 | $5,947 | $16,303 |
| 2015 | $1,121 | $21,861 | $5,558 | $16,303 |
| 2014 | $1,115 | $21,861 | $5,558 | $16,303 |
| 2013 | $1,117 | $21,861 | $5,558 | $16,303 |
Source: Public Records
Map
Nearby Homes
- 16 Laurel Rd
- 0 Kennedy Rd
- 1037 Frayne Dr
- 819 Hedwick St
- 419 E Carpenter Dr
- 842 Edgewick Rd
- 634 Bowser Dr
- 1689 Dale Ridge Rd
- 212 Monroe Way
- 209 Monroe Way
- 12165 Dille Rd
- 232 E Main St
- 1292 Medway New Carlisle Rd
- 11315 W National Rd
- 738 S Medway Carlisle Rd
- 9892 S Palmer Rd
- 0 N Dayton-Lakeview Rd Unit 944532
- 0 N Dayton-Lakeview Rd Unit 1041631
- 11501 Zeller Dr
- 10850 Musselman Rd