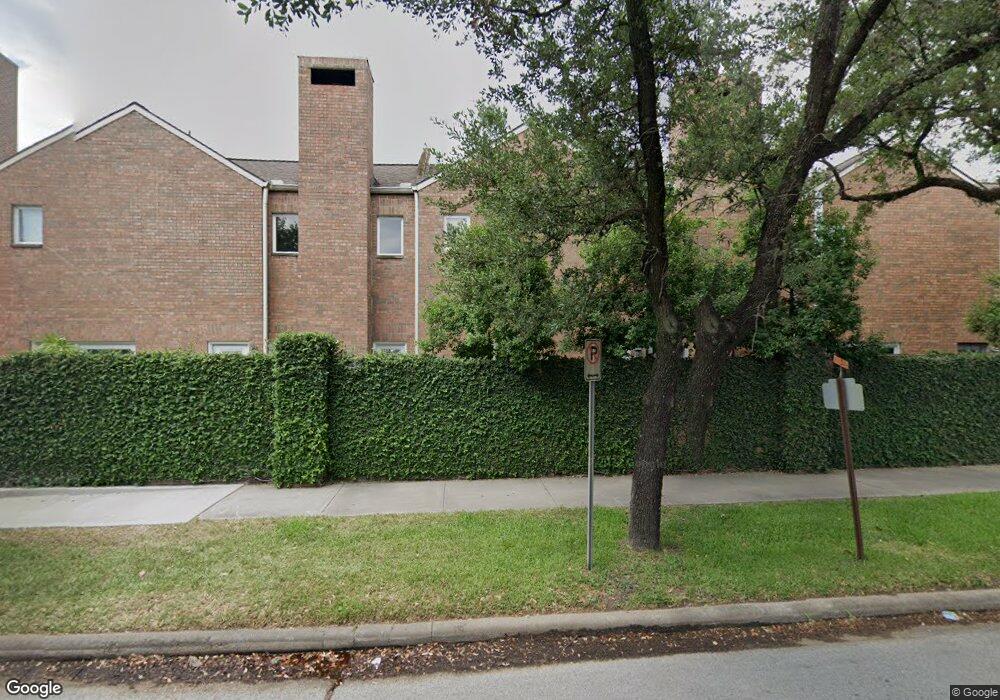
6700 Belmont St Unit 4 Houston, TX 77005
Estimated Value: $712,381 - $1,349,000
3
Beds
3
Baths
2,787
Sq Ft
$329/Sq Ft
Est. Value
About This Home
This home is located at 6700 Belmont St Unit 4, Houston, TX 77005 and is currently estimated at $918,095, approximately $329 per square foot. 6700 Belmont St Unit 4 is a home located in Harris County with nearby schools including West University Elementary School, Pershing Middle School, and Lamar High School.
Ownership History
Date
Name
Owned For
Owner Type
Purchase Details
Closed on
Feb 14, 2014
Sold by
Gudenrath Jeffrey Phillip
Bought by
Cude Jill B and Cude Ronald G
Current Estimated Value
Purchase Details
Closed on
Oct 23, 2012
Sold by
Gudenrath Jeffrey Phillip
Bought by
Gudenrath Jeffrey Phillip
Home Financials for this Owner
Home Financials are based on the most recent Mortgage that was taken out on this home.
Original Mortgage
$170,800
Interest Rate
3.59%
Mortgage Type
New Conventional
Purchase Details
Closed on
Dec 20, 1993
Sold by
Allen Mary B
Bought by
Wyllie Stella A
Home Financials for this Owner
Home Financials are based on the most recent Mortgage that was taken out on this home.
Original Mortgage
$35,500
Interest Rate
7.06%
Mortgage Type
Seller Take Back
Create a Home Valuation Report for This Property
The Home Valuation Report is an in-depth analysis detailing your home's value as well as a comparison with similar homes in the area
Home Values in the Area
Average Home Value in this Area
Purchase History
| Date | Buyer | Sale Price | Title Company |
|---|---|---|---|
| Cude Jill B | -- | None Available | |
| Gudenrath Jeffrey Phillip | -- | None Available | |
| Wyllie Stella A | -- | -- |
Source: Public Records
Mortgage History
| Date | Status | Borrower | Loan Amount |
|---|---|---|---|
| Previous Owner | Gudenrath Jeffrey Phillip | $170,800 | |
| Previous Owner | Wyllie Stella A | $35,500 |
Source: Public Records
Tax History Compared to Growth
Tax History
| Year | Tax Paid | Tax Assessment Tax Assessment Total Assessment is a certain percentage of the fair market value that is determined by local assessors to be the total taxable value of land and additions on the property. | Land | Improvement |
|---|---|---|---|---|
| 2025 | $4,883 | $754,316 | $267,300 | $487,016 |
| 2024 | $4,883 | $690,412 | $267,300 | $423,112 |
| 2023 | $4,883 | $725,382 | $267,300 | $458,082 |
| 2022 | $11,844 | $608,760 | $267,300 | $341,460 |
| 2021 | $12,467 | $605,686 | $267,300 | $338,386 |
| 2020 | $12,329 | $570,026 | $267,300 | $302,726 |
| 2019 | $12,272 | $543,259 | $267,300 | $275,959 |
| 2018 | $6,832 | $510,372 | $267,300 | $243,072 |
| 2017 | $11,529 | $510,372 | $267,300 | $243,072 |
| 2016 | $11,323 | $510,372 | $267,300 | $243,072 |
| 2015 | $7,213 | $510,372 | $267,300 | $243,072 |
| 2014 | $7,213 | $398,699 | $240,570 | $158,129 |
Source: Public Records
Map
Nearby Homes
- 6723 Belmont St
- 6626 Brompton Rd
- 2930 Brompton Square Dr
- 6728 Buffalo Speedway
- 2910 Brompton Square Dr
- 2828 W Holcombe Blvd Unit I
- 2907 Brompton Square Dr
- 4 Rutgers Place
- 6604 Vanderbilt St
- 2737 Werlein Ave
- 6635 Rutgers Ave
- 6535 Buffalo Speedway
- 3200 Bellefontaine St Unit 65
- 3200 Bellefontaine St Unit 72
- 3220 Maroneal St
- 6626 Westchester Ave
- 2700 Bellefontaine St Unit A6
- 2700 Bellefontaine St Unit A24
- 2700 Bellefontaine St Unit B14W
- 3350 Maroneal St
- 6700 Belmont St Unit 1
- 6700 Belmont St Unit 10
- 6700 Belmont St Unit 3
- 6700 Belmont St Unit 11
- 6700 Belmont St Unit 8
- 6700 Belmont St Unit 2
- 6700 Belmont St Unit 6
- 6700 Belmont St Unit 9
- 6700 Belmont St Unit 12
- 6700 Belmont St
- 6700 Belmont St Unit 5
- 6718 Belmont St
- 6714 Belmont St
- 6729 Vanderbilt St
- 6727 Vanderbilt St
- 6731 Vanderbilt St
- 6725 Vanderbilt St
- 6710 Belmont St
- 6733 Vanderbilt St
- 6723 Vanderbilt St