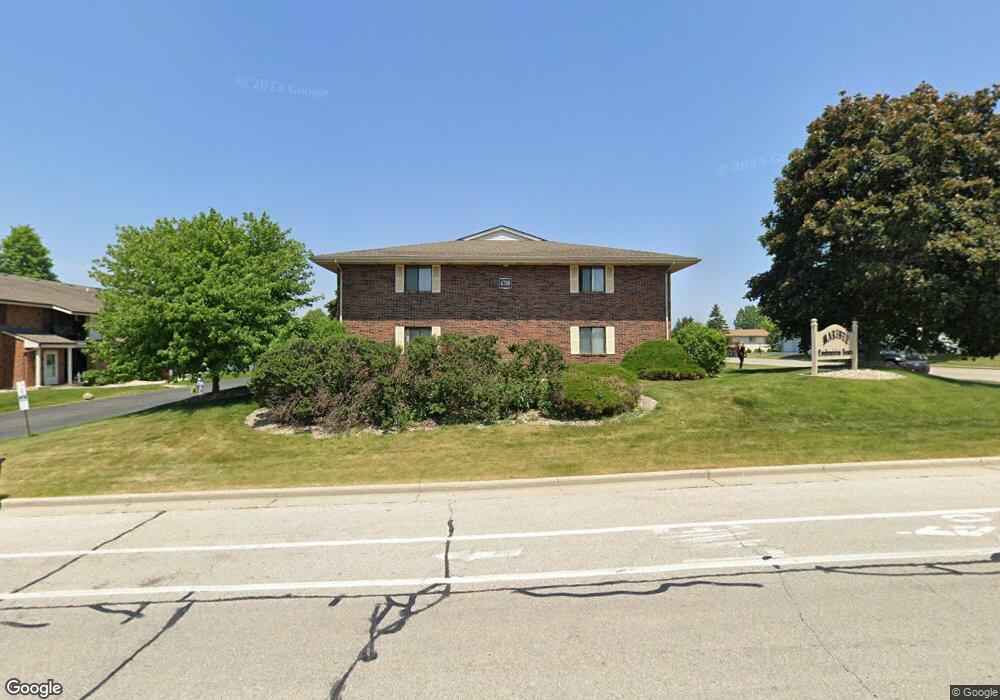
6700 Mariner Dr Unit 201 Mount Pleasant, WI 53406
Estimated Value: $145,000 - $165,000
2
Beds
2
Baths
1,056
Sq Ft
$149/Sq Ft
Est. Value
About This Home
This home is located at 6700 Mariner Dr Unit 201, Mount Pleasant, WI 53406 and is currently estimated at $156,847, approximately $148 per square foot. 6700 Mariner Dr Unit 201 is a home located in Racine County with nearby schools including West Ridge Elementary School, Mitchell Middle School, and Case High School.
Ownership History
Date
Name
Owned For
Owner Type
Purchase Details
Closed on
Feb 27, 2019
Sold by
Tng 3 Llc
Bought by
Leffler Matthew R
Current Estimated Value
Home Financials for this Owner
Home Financials are based on the most recent Mortgage that was taken out on this home.
Original Mortgage
$48,000
Outstanding Balance
$42,029
Interest Rate
4.4%
Mortgage Type
New Conventional
Estimated Equity
$114,818
Purchase Details
Closed on
Jun 26, 2014
Sold by
Secretary Of Hud
Bought by
Tng 3 Llc
Purchase Details
Closed on
Jan 27, 2014
Sold by
Wells Fargo Bank Na
Bought by
The Secretary Of Hud
Purchase Details
Closed on
Jan 8, 2014
Sold by
Dycus Heather A
Bought by
Wells Fargo Bank Na
Purchase Details
Closed on
May 19, 2006
Sold by
As Nancy Stark and Agreement Dated March Zi Zooz
Bought by
Dycus Heather A
Home Financials for this Owner
Home Financials are based on the most recent Mortgage that was taken out on this home.
Original Mortgage
$105,248
Interest Rate
6.62%
Mortgage Type
FHA
Create a Home Valuation Report for This Property
The Home Valuation Report is an in-depth analysis detailing your home's value as well as a comparison with similar homes in the area
Home Values in the Area
Average Home Value in this Area
Purchase History
| Date | Buyer | Sale Price | Title Company |
|---|---|---|---|
| Leffler Matthew R | $64,000 | None Available | |
| Tng 3 Llc | -- | Ambassador Title Corp | |
| The Secretary Of Hud | $46,800 | None Available | |
| Wells Fargo Bank Na | -- | None Available | |
| Dycus Heather A | $106,900 | -- |
Source: Public Records
Mortgage History
| Date | Status | Borrower | Loan Amount |
|---|---|---|---|
| Open | Leffler Matthew R | $48,000 | |
| Previous Owner | Dycus Heather A | $105,248 |
Source: Public Records
Tax History Compared to Growth
Tax History
| Year | Tax Paid | Tax Assessment Tax Assessment Total Assessment is a certain percentage of the fair market value that is determined by local assessors to be the total taxable value of land and additions on the property. | Land | Improvement |
|---|---|---|---|---|
| 2024 | $2,197 | $134,300 | $9,400 | $124,900 |
| 2023 | $2,252 | $133,200 | $8,800 | $124,400 |
| 2022 | $2,118 | $125,300 | $8,800 | $116,500 |
| 2021 | $2,103 | $110,600 | $8,000 | $102,600 |
| 2020 | $1,735 | $89,900 | $6,000 | $83,900 |
| 2019 | $1,501 | $81,300 | $6,000 | $75,300 |
| 2018 | $1,434 | $72,400 | $6,000 | $66,400 |
| 2017 | $1,323 | $66,200 | $6,000 | $60,200 |
| 2016 | $1,310 | $61,700 | $6,000 | $55,700 |
| 2015 | $1,253 | $61,700 | $6,000 | $55,700 |
| 2014 | $1,080 | $61,700 | $6,000 | $55,700 |
| 2013 | $1,188 | $61,700 | $6,000 | $55,700 |
Source: Public Records
Map
Nearby Homes
- 1101 S Sunnyslope Dr Unit 3L
- Lt0 Mariner Dr
- 6940 Mariner Dr Unit 101
- 7020 Mariner Dr Unit 106
- 1021 Prairie Dr Unit 101
- 6342 Kinzie Ave
- 6355 Kingsview Dr
- 1040 Prairie Dr Unit 23
- 6352 Kelsey Ct
- 353 Quail Point Dr
- 6343 Ptarmigan Rd
- 586 Calvin Ln
- 838 Boulder Trail Unit 205
- Cedar Point Plan at Christina Estates
- 921 Village Center Dr Unit DR203
- 6300 Bald Eagle Rd
- 6236 Bald Eagle Rd
- 5740 Woodland Hills Dr
- 1117 N Sunnyslope Dr Unit 204
- 1435 Sun Valley Dr Unit 201
- 6700 Mariner Dr Unit 204
- 6700 Mariner Dr Unit 202
- 6700 Mariner Dr Unit 104
- 6700 Mariner Dr Unit 103
- 6700 Mariner Dr Unit 102
- 6700 Mariner Dr Unit 101
- 6720 Mariner Dr Unit 204
- 6720 Mariner Dr Unit 203
- 6720 Mariner Dr Unit 202
- 6720 Mariner Dr Unit 201
- 6720 Mariner Dr Unit 104
- 6720 Mariner Dr Unit 103
- 6720 Mariner Dr Unit 102
- 6720 Mariner Dr
- 6720 Mariner Dr Unit 6720
- 6650 Mariner Dr Unit 204
- 6650 Mariner Dr Unit 203
- 6650 Mariner Dr Unit 202
- 6650 Mariner Dr Unit 201
- 6650 Mariner Dr Unit 104