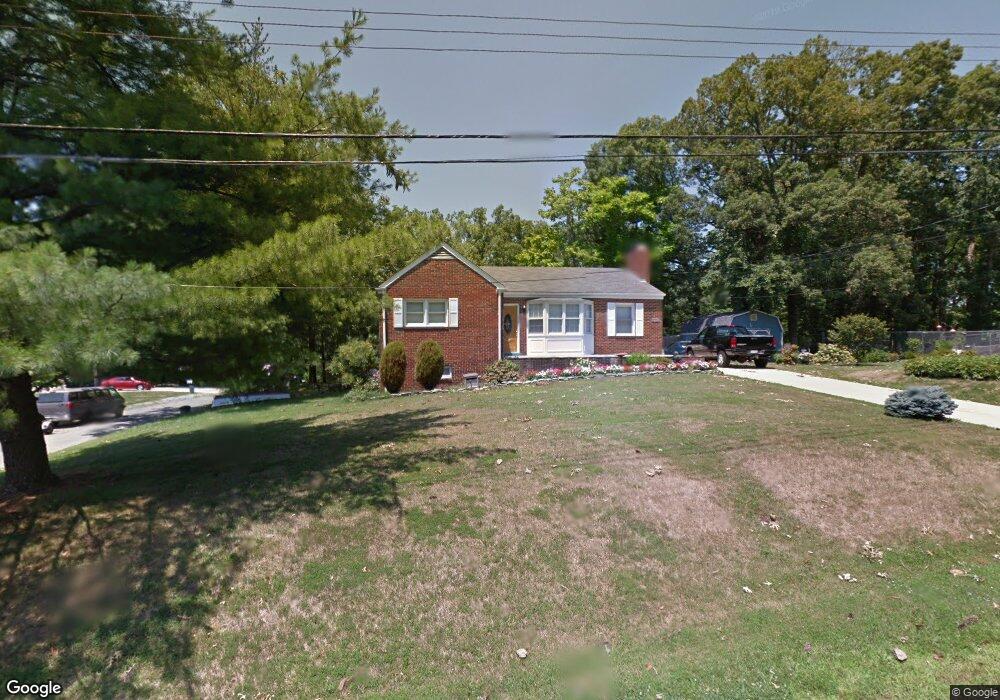
6700 Oakland Ave Riverdale, MD 20737
Estimated Value: $456,000 - $496,000
--
Bed
3
Baths
1,272
Sq Ft
$374/Sq Ft
Est. Value
About This Home
This home is located at 6700 Oakland Ave, Riverdale, MD 20737 and is currently estimated at $475,558, approximately $373 per square foot. 6700 Oakland Ave is a home located in Prince George's County with nearby schools including Lamont Elementary School, Charles Carroll Middle School, and Parkdale High School.
Ownership History
Date
Name
Owned For
Owner Type
Purchase Details
Closed on
May 30, 2025
Sold by
Odonnell Dorothy
Bought by
Orellana Ena M Carpio and Milian Hilario A
Current Estimated Value
Home Financials for this Owner
Home Financials are based on the most recent Mortgage that was taken out on this home.
Original Mortgage
$469,067
Outstanding Balance
$467,441
Interest Rate
6.76%
Mortgage Type
FHA
Estimated Equity
$8,117
Purchase Details
Closed on
Dec 6, 1972
Sold by
Goodloe Colby S
Bought by
Donnell Thomas M O and Donnell Dorothy J
Create a Home Valuation Report for This Property
The Home Valuation Report is an in-depth analysis detailing your home's value as well as a comparison with similar homes in the area
Home Values in the Area
Average Home Value in this Area
Purchase History
| Date | Buyer | Sale Price | Title Company |
|---|---|---|---|
| Orellana Ena M Carpio | $500,000 | Old Republic National Title In | |
| Donnell Thomas M O | $37,000 | -- |
Source: Public Records
Mortgage History
| Date | Status | Borrower | Loan Amount |
|---|---|---|---|
| Open | Orellana Ena M Carpio | $469,067 |
Source: Public Records
Tax History Compared to Growth
Tax History
| Year | Tax Paid | Tax Assessment Tax Assessment Total Assessment is a certain percentage of the fair market value that is determined by local assessors to be the total taxable value of land and additions on the property. | Land | Improvement |
|---|---|---|---|---|
| 2025 | $4,147 | $347,233 | -- | -- |
| 2024 | $4,147 | $327,600 | $112,300 | $215,300 |
| 2023 | $3,496 | $314,400 | $0 | $0 |
| 2022 | $3,855 | $301,200 | $0 | $0 |
| 2021 | $3,696 | $288,000 | $101,100 | $186,900 |
| 2020 | $0 | $270,400 | $0 | $0 |
| 2019 | $3,470 | $252,800 | $0 | $0 |
| 2018 | $3,313 | $235,200 | $76,100 | $159,100 |
| 2017 | $3,176 | $214,700 | $0 | $0 |
| 2016 | -- | $194,200 | $0 | $0 |
| 2015 | $3,058 | $173,700 | $0 | $0 |
| 2014 | $3,058 | $173,700 | $0 | $0 |
Source: Public Records
Map
Nearby Homes