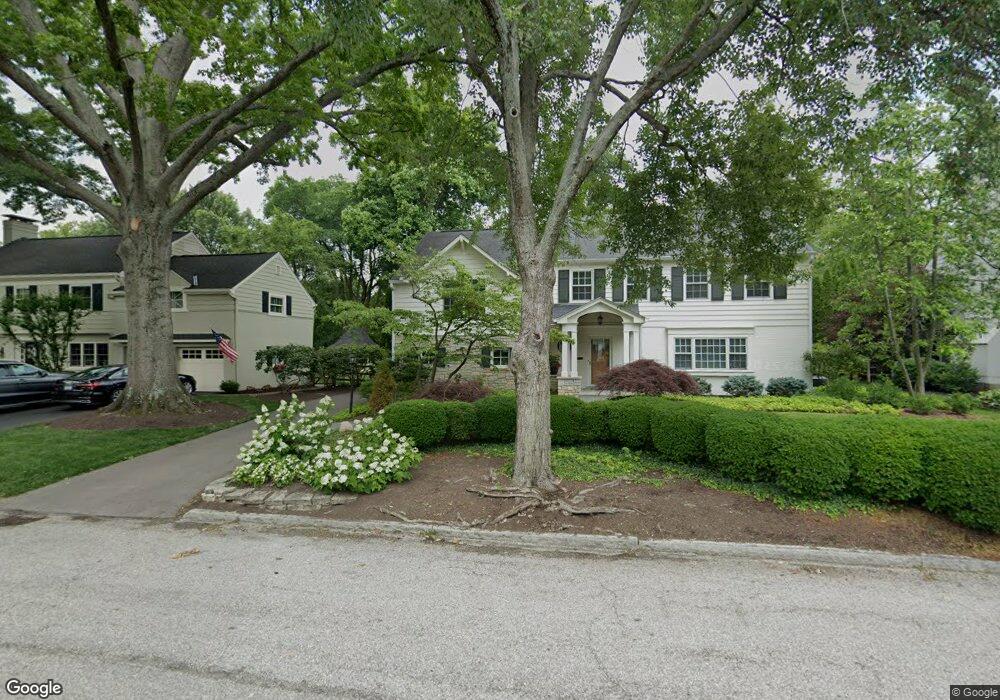
6702 Mariemont Ave Cincinnati, OH 45227
Estimated Value: $931,000 - $1,289,000
4
Beds
3
Baths
3,113
Sq Ft
$353/Sq Ft
Est. Value
About This Home
This home is located at 6702 Mariemont Ave, Cincinnati, OH 45227 and is currently estimated at $1,099,639, approximately $353 per square foot. 6702 Mariemont Ave is a home located in Hamilton County with nearby schools including Terrace Park Elementary School, Mariemont Elementary School, and Mariemont High School.
Ownership History
Date
Name
Owned For
Owner Type
Purchase Details
Closed on
Dec 12, 2006
Sold by
Walsh Thomas J and Walsh Holly B
Bought by
Walsh Thomas J and Walsh Holly B
Current Estimated Value
Purchase Details
Closed on
Jun 30, 2006
Sold by
Makatan Properties Llc
Bought by
Walsh Thomas J and Budig Holly B
Home Financials for this Owner
Home Financials are based on the most recent Mortgage that was taken out on this home.
Original Mortgage
$325,000
Outstanding Balance
$189,588
Interest Rate
6.72%
Mortgage Type
Unknown
Estimated Equity
$910,051
Purchase Details
Closed on
Apr 14, 2006
Sold by
Roberts Margaret Rodger
Bought by
Makatan Properties Llc
Home Financials for this Owner
Home Financials are based on the most recent Mortgage that was taken out on this home.
Original Mortgage
$479,200
Interest Rate
6.34%
Mortgage Type
Unknown
Create a Home Valuation Report for This Property
The Home Valuation Report is an in-depth analysis detailing your home's value as well as a comparison with similar homes in the area
Home Values in the Area
Average Home Value in this Area
Purchase History
| Date | Buyer | Sale Price | Title Company |
|---|---|---|---|
| Walsh Thomas J | -- | Attorney | |
| Walsh Thomas J | -- | None Available | |
| Makatan Properties Llc | -- | None Available |
Source: Public Records
Mortgage History
| Date | Status | Borrower | Loan Amount |
|---|---|---|---|
| Open | Walsh Thomas J | $325,000 | |
| Previous Owner | Makatan Properties Llc | $479,200 |
Source: Public Records
Tax History
| Year | Tax Paid | Tax Assessment Tax Assessment Total Assessment is a certain percentage of the fair market value that is determined by local assessors to be the total taxable value of land and additions on the property. | Land | Improvement |
|---|---|---|---|---|
| 2025 | $19,095 | $271,212 | $128,048 | $143,164 |
| 2023 | $17,215 | $271,212 | $128,048 | $143,164 |
| 2022 | $20,192 | $269,494 | $103,079 | $166,415 |
| 2021 | $19,711 | $269,494 | $103,079 | $166,415 |
| 2020 | $19,910 | $269,494 | $103,079 | $166,415 |
| 2019 | $19,144 | $236,397 | $90,419 | $145,978 |
| 2018 | $19,136 | $218,705 | $90,419 | $128,286 |
| 2017 | $15,069 | $218,705 | $90,419 | $128,286 |
| 2016 | $12,752 | $183,177 | $76,521 | $106,656 |
| 2015 | $12,886 | $183,177 | $76,521 | $106,656 |
| 2014 | $12,897 | $183,177 | $76,521 | $106,656 |
| 2013 | $11,278 | $168,053 | $70,203 | $97,850 |
Source: Public Records
Map
Nearby Homes
- 6307 Wooster Pike
- 3662 Birkdale Ln
- 3645 Birkdale Ln
- 3669 Birkdale Ln
- 3665 Birkdale Ln
- 3653 Birkdale Ln
- 3657 Birkdale Ln
- 3649 Birkdale Ln
- 6949 Cambridge Ave
- 3641 Birkdale Ln
- 3817 Indianview Ave
- 3723 Carlton Ave
- 3969 Miami Rd
- 3730 Simpson Ave
- 3710 Watterson Rd
- 3766 Miami Run
- 6613 Bramble Ave
- 3746 Miami Run
- 3763 Miami Run
- 3767 Miami Run
- 6706 Mariemont Ave
- 6708 Mariemont Ave
- 3700 Pleasant St
- 2 Denny Place
- 1 Denny Place
- 3706 Pleasant St
- 3 Denny Place
- 6705 Mariemont Ave
- 4 Denny Place
- 6703 Mariemont Ave
- 6710 Mariemont Ave
- 6709 Mariemont Ave
- 3708 Pleasant St
- 3610 Pleasant St
- 5 Denny Place
- 6711 Mariemont Ave
- 14 Denny Place
- 3800 Miami Rd
- 6720 Hammerstone Way
- 6718 Hammerstone Way
Your Personal Tour Guide
Ask me questions while you tour the home.