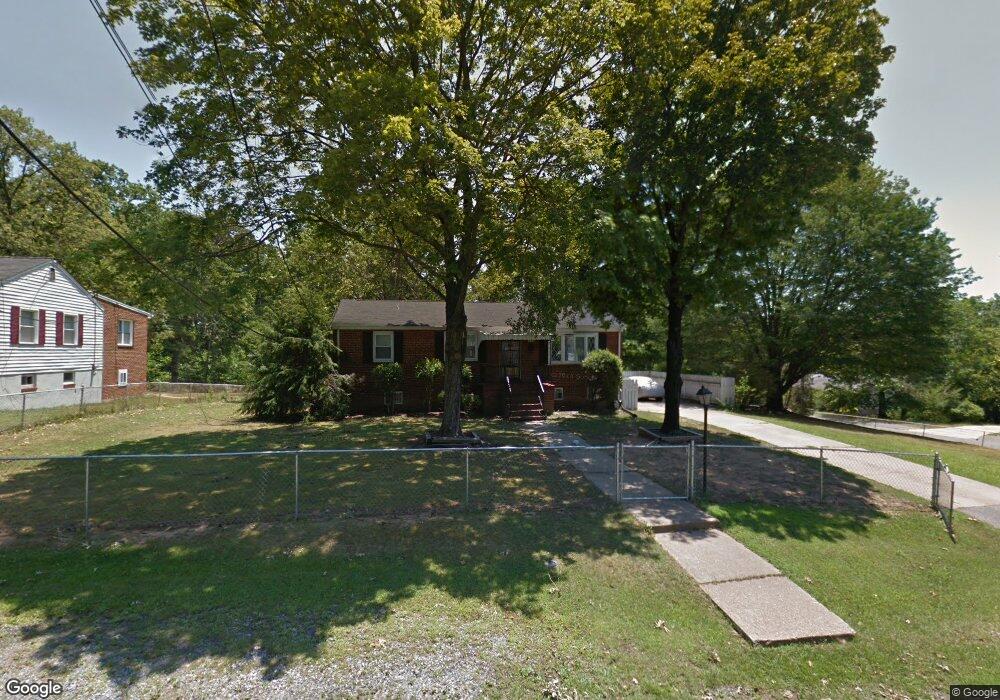
6705 Oakland Ave Riverdale, MD 20737
Estimated Value: $430,000 - $444,000
--
Bed
2
Baths
1,232
Sq Ft
$356/Sq Ft
Est. Value
About This Home
This home is located at 6705 Oakland Ave, Riverdale, MD 20737 and is currently estimated at $439,107, approximately $356 per square foot. 6705 Oakland Ave is a home located in Prince George's County with nearby schools including Lamont Elementary School, Charles Carroll Middle School, and Parkdale High School.
Ownership History
Date
Name
Owned For
Owner Type
Purchase Details
Closed on
Nov 4, 2004
Sold by
Williams Wylie R Jr Etal
Bought by
Smith Darryl A
Current Estimated Value
Purchase Details
Closed on
Feb 24, 2004
Sold by
Williams Wylie R
Bought by
Williams Wylie R and Williams Darryl A
Purchase Details
Closed on
Feb 17, 2004
Sold by
Williams Wylie R Jr Etal
Bought by
Smith Darryl A
Purchase Details
Closed on
Sep 11, 1997
Sold by
Carroll Melvin F
Bought by
Williams Wylie R
Create a Home Valuation Report for This Property
The Home Valuation Report is an in-depth analysis detailing your home's value as well as a comparison with similar homes in the area
Home Values in the Area
Average Home Value in this Area
Purchase History
| Date | Buyer | Sale Price | Title Company |
|---|---|---|---|
| Smith Darryl A | -- | -- | |
| Williams Wylie R | -- | -- | |
| Smith Darryl A | -- | -- | |
| Williams Wylie R | $134,000 | -- |
Source: Public Records
Tax History Compared to Growth
Tax History
| Year | Tax Paid | Tax Assessment Tax Assessment Total Assessment is a certain percentage of the fair market value that is determined by local assessors to be the total taxable value of land and additions on the property. | Land | Improvement |
|---|---|---|---|---|
| 2025 | $4,029 | $334,667 | -- | -- |
| 2024 | $4,029 | $316,200 | $113,200 | $203,000 |
| 2023 | $3,904 | $303,400 | $0 | $0 |
| 2022 | $3,231 | $290,600 | $0 | $0 |
| 2021 | $7,336 | $277,800 | $101,600 | $176,200 |
| 2020 | $6,980 | $260,733 | $0 | $0 |
| 2019 | $3,489 | $243,667 | $0 | $0 |
| 2018 | $3,160 | $226,600 | $76,600 | $150,000 |
| 2017 | $3,094 | $207,267 | $0 | $0 |
| 2016 | -- | $187,933 | $0 | $0 |
| 2015 | $3,094 | $168,600 | $0 | $0 |
| 2014 | $3,094 | $168,600 | $0 | $0 |
Source: Public Records
Map
Nearby Homes