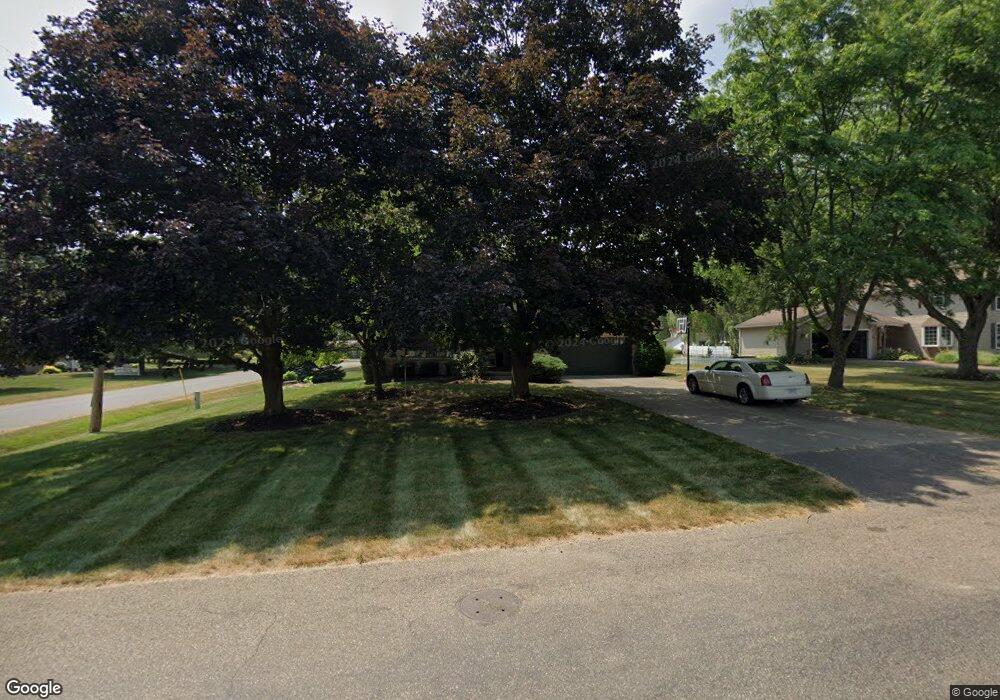
6705 Towpath Ave NW Canal Fulton, OH 44614
Estimated Value: $277,472 - $298,000
3
Beds
2
Baths
1,652
Sq Ft
$173/Sq Ft
Est. Value
About This Home
This home is located at 6705 Towpath Ave NW, Canal Fulton, OH 44614 and is currently estimated at $285,618, approximately $172 per square foot. 6705 Towpath Ave NW is a home located in Stark County with nearby schools including W.S. Stinson Elementary School, Northwest Primary School, and Northwest Middle School.
Ownership History
Date
Name
Owned For
Owner Type
Purchase Details
Closed on
Nov 18, 2002
Sold by
Gardner James G
Bought by
Iddings Terry E and Iddings Laura J
Current Estimated Value
Home Financials for this Owner
Home Financials are based on the most recent Mortgage that was taken out on this home.
Original Mortgage
$140,750
Outstanding Balance
$59,821
Interest Rate
6.22%
Mortgage Type
FHA
Estimated Equity
$225,797
Purchase Details
Closed on
Nov 9, 2000
Sold by
Matthew Butti
Bought by
Gardner James G
Home Financials for this Owner
Home Financials are based on the most recent Mortgage that was taken out on this home.
Original Mortgage
$128,750
Interest Rate
7.91%
Mortgage Type
VA
Purchase Details
Closed on
Jul 14, 1995
Sold by
Lee Patsy A
Bought by
Butti Matthew
Home Financials for this Owner
Home Financials are based on the most recent Mortgage that was taken out on this home.
Original Mortgage
$80,400
Interest Rate
7.79%
Mortgage Type
New Conventional
Create a Home Valuation Report for This Property
The Home Valuation Report is an in-depth analysis detailing your home's value as well as a comparison with similar homes in the area
Home Values in the Area
Average Home Value in this Area
Purchase History
| Date | Buyer | Sale Price | Title Company |
|---|---|---|---|
| Iddings Terry E | $143,000 | Mk Title Agency Of Stark Cou | |
| Gardner James G | $125,000 | -- | |
| Butti Matthew | $100,500 | -- |
Source: Public Records
Mortgage History
| Date | Status | Borrower | Loan Amount |
|---|---|---|---|
| Open | Iddings Terry E | $140,750 | |
| Previous Owner | Gardner James G | $128,750 | |
| Previous Owner | Butti Matthew | $80,400 |
Source: Public Records
Tax History Compared to Growth
Tax History
| Year | Tax Paid | Tax Assessment Tax Assessment Total Assessment is a certain percentage of the fair market value that is determined by local assessors to be the total taxable value of land and additions on the property. | Land | Improvement |
|---|---|---|---|---|
| 2025 | -- | $77,420 | $16,800 | $60,620 |
| 2024 | -- | $77,420 | $16,800 | $60,620 |
| 2023 | $2,593 | $57,050 | $14,210 | $42,840 |
| 2022 | $2,593 | $57,050 | $14,210 | $42,840 |
| 2021 | $2,599 | $57,050 | $14,210 | $42,840 |
| 2020 | $2,401 | $47,120 | $11,450 | $35,670 |
| 2019 | $2,428 | $47,120 | $11,450 | $35,670 |
| 2018 | $2,372 | $47,120 | $11,450 | $35,670 |
| 2017 | $2,215 | $41,720 | $8,610 | $33,110 |
| 2016 | $2,226 | $41,720 | $8,610 | $33,110 |
| 2015 | $2,232 | $41,720 | $8,610 | $33,110 |
| 2014 | $87 | $36,020 | $7,420 | $28,600 |
| 2013 | $1,029 | $36,020 | $7,420 | $28,600 |
Source: Public Records
Map
Nearby Homes
- 782 Beverly Ave
- 919 Baffin Dr
- 915 Shackleton Dr
- 12347 Stover Farm Dr NW
- 1719 Bruce St
- 1808 Pauli St
- 2101 Livingston Dr
- 921 Cabot Dr
- 764 Chris Cir
- 707 Parkview Ave
- 872 Sandlewood Dr NW
- 10778 Yare Cir NW
- 0 V L Milhaven Ave NW
- S/L 32 Lakewood Dr E
- S/L 27 Lakewood Dr E
- 539 E Lakewood Dr
- 537 E Lakewood Dr
- 542 E Lakewood Dr
- 11380 Banning Cir NW
- 765 Longview Ave
- 6723 Towpath Ave NW
- 11877 Mill Race St NW
- 11858 Mill Race St NW
- 11874 Mill Race St NW
- 11893 Mill Race St NW
- 6704 Towpath Ave NW
- 6722 Towpath Ave NW
- 6657 Towpath Ave NW
- 11911 Mill Race St NW
- 11880 Mill Race St NW
- 6744 Towpath Ave NW
- 6763 Towpath Ave NW
- 11886 Mill Race St NW
- 11886 Mill Race N W
- 11919 Mill Race St NW
- 6641 Towpath Ave NW
- 11910 Lockland Cir NW
- 11915 Lockland Cir NW
- 6764 Towpath Ave NW
- 6781 Towpath Ave NW