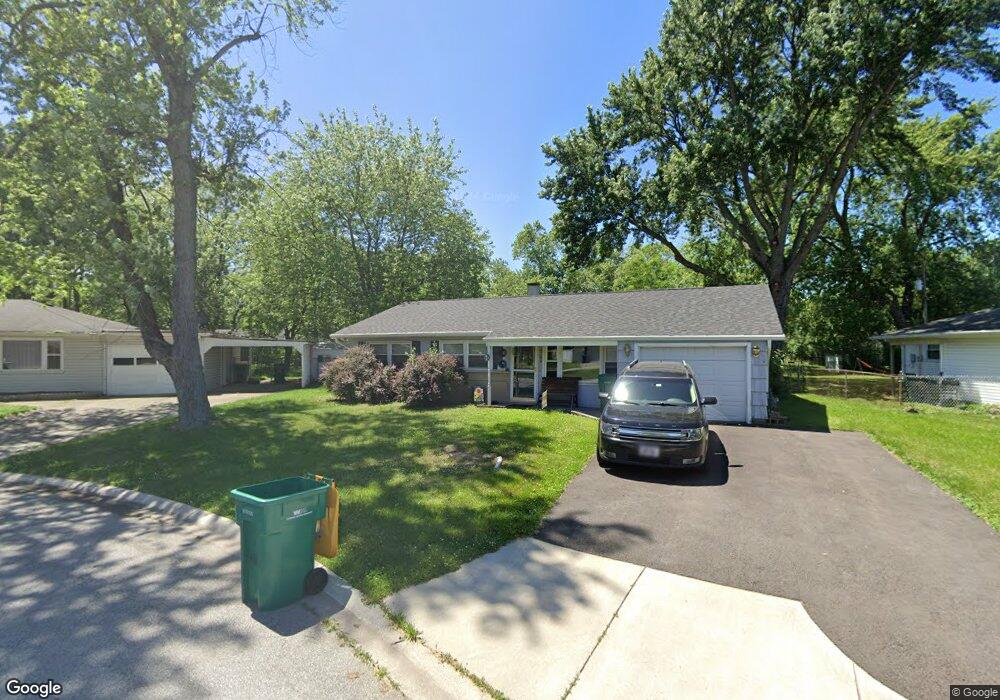
6706 Monroe Ct Merrillville, IN 46410
Turkey Creek NeighborhoodEstimated Value: $182,000 - $198,000
3
Beds
1
Bath
1,128
Sq Ft
$171/Sq Ft
Est. Value
About This Home
This home is located at 6706 Monroe Ct, Merrillville, IN 46410 and is currently estimated at $193,071, approximately $171 per square foot. 6706 Monroe Ct is a home located in Lake County with nearby schools including Homer Iddings Elementary School, Merrillville Intermediate School, and Pierce Middle School.
Ownership History
Date
Name
Owned For
Owner Type
Purchase Details
Closed on
Jun 24, 2016
Sold by
Branningan Nicholas J
Bought by
Cook Marquita S
Current Estimated Value
Home Financials for this Owner
Home Financials are based on the most recent Mortgage that was taken out on this home.
Original Mortgage
$88,369
Outstanding Balance
$71,011
Interest Rate
3.87%
Mortgage Type
FHA
Estimated Equity
$122,060
Purchase Details
Closed on
Jul 21, 2011
Sold by
Lake County Trust Company
Bought by
Branningham Nicholas J
Purchase Details
Closed on
Aug 6, 2010
Sold by
Holem Bryan K and First Magnus Financial Corpora
Bought by
Aurora Loan Services Llc
Purchase Details
Closed on
Jan 10, 2006
Sold by
Holem Bryan K
Bought by
Hbk Llc
Purchase Details
Closed on
Sep 29, 2005
Sold by
Hbk Llc
Bought by
Holem Bryan K
Home Financials for this Owner
Home Financials are based on the most recent Mortgage that was taken out on this home.
Original Mortgage
$68,250
Interest Rate
6.5%
Mortgage Type
Fannie Mae Freddie Mac
Create a Home Valuation Report for This Property
The Home Valuation Report is an in-depth analysis detailing your home's value as well as a comparison with similar homes in the area
Home Values in the Area
Average Home Value in this Area
Purchase History
| Date | Buyer | Sale Price | Title Company |
|---|---|---|---|
| Cook Marquita S | -- | Barrister Title | |
| Branningham Nicholas J | -- | None Available | |
| Aurora Loan Services Llc | $37,490 | None Available | |
| Hbk Llc | -- | Accommodation | |
| Holem Bryan K | -- | Ticor Title Insurance |
Source: Public Records
Mortgage History
| Date | Status | Borrower | Loan Amount |
|---|---|---|---|
| Open | Cook Marquita S | $88,369 | |
| Previous Owner | Holem Bryan K | $68,250 |
Source: Public Records
Tax History Compared to Growth
Tax History
| Year | Tax Paid | Tax Assessment Tax Assessment Total Assessment is a certain percentage of the fair market value that is determined by local assessors to be the total taxable value of land and additions on the property. | Land | Improvement |
|---|---|---|---|---|
| 2024 | $2,727 | $118,100 | $40,200 | $77,900 |
| 2023 | $719 | $116,400 | $39,000 | $77,400 |
| 2022 | $719 | $102,100 | $33,400 | $68,700 |
| 2021 | $557 | $90,000 | $31,200 | $58,800 |
| 2020 | $516 | $87,500 | $30,300 | $57,200 |
| 2019 | $798 | $89,500 | $30,300 | $59,200 |
| 2018 | $797 | $88,400 | $30,300 | $58,100 |
| 2017 | $840 | $88,200 | $30,300 | $57,900 |
| 2016 | $797 | $87,400 | $29,100 | $58,300 |
| 2014 | $1,817 | $85,500 | $28,200 | $57,300 |
| 2013 | $1,903 | $85,900 | $30,000 | $55,900 |
Source: Public Records
Map
Nearby Homes
- 6746 Madison St
- 6709 Jefferson St
- 754 W 67th Ave
- 6777 Polk St
- 7020 Harrison St
- 855 W 70th Place
- 7011 Tyler Ct
- 5455 Connecticut St
- 1107 W 63rd Ave
- 1136 W 72nd Cir
- 7105 Grant St
- 7125 Grant St
- 7064 Grant St
- 7127 Grant St
- 7084 Grant St
- 7130 Delaware St
- 5790 Adams St
- 7195 Grant St
- 919 W 61st Ave
- 7235 Grant St
- 6700 Monroe Ct
- 6718 Monroe Ct
- 6707 Jackson St
- 6692 Monroe Ct
- 6717 Jackson St
- 6701 Jackson St
- 6727 Jackson St
- 6726 Monroe Ct
- 6691 Jackson St
- 6682 Monroe Ct
- 6707 Monroe Ct
- 6701 Monroe Ct
- 6727 Monroe Ct
- 6737 Jackson St
- 6681 Jackson St
- 6691 Monroe Ct
- 6719 Monroe Ct
- 6672 Monroe Ct
- 6681 Monroe Ct
- 514 W 67th Ln