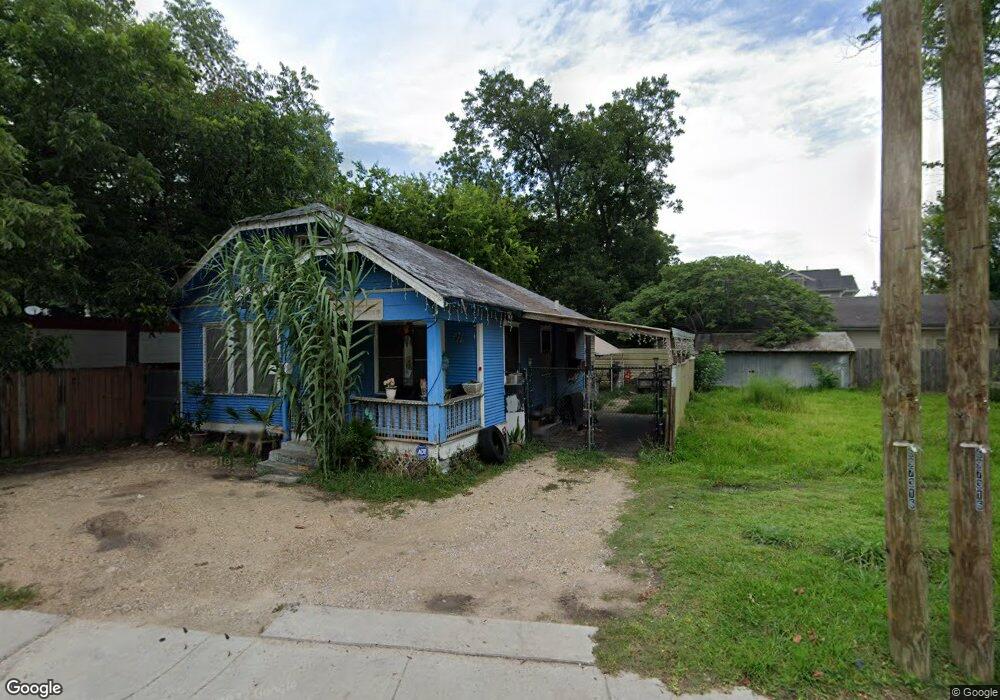
6706 N Main St Houston, TX 77009
Greater Heights NeighborhoodEstimated Value: $683,000
2
Beds
1
Bath
900
Sq Ft
$759/Sq Ft
Est. Value
About This Home
This home is located at 6706 N Main St, Houston, TX 77009 and is currently estimated at $683,000, approximately $758 per square foot. 6706 N Main St is a home located in Harris County with nearby schools including Field Elementary School, Hamilton Middle, and Heights High School.
Ownership History
Date
Name
Owned For
Owner Type
Purchase Details
Closed on
Apr 30, 2024
Sold by
North Main Condos Llc
Bought by
Srl International Llc
Current Estimated Value
Purchase Details
Closed on
Jul 16, 2021
Sold by
Manco Associates Llc
Bought by
North Main Condos Llc
Home Financials for this Owner
Home Financials are based on the most recent Mortgage that was taken out on this home.
Original Mortgage
$2,605,292
Interest Rate
2.9%
Mortgage Type
Construction
Create a Home Valuation Report for This Property
The Home Valuation Report is an in-depth analysis detailing your home's value as well as a comparison with similar homes in the area
Home Values in the Area
Average Home Value in this Area
Purchase History
| Date | Buyer | Sale Price | Title Company |
|---|---|---|---|
| Srl International Llc | -- | None Listed On Document | |
| North Main Condos Llc | -- | None Listed On Document |
Source: Public Records
Mortgage History
| Date | Status | Borrower | Loan Amount |
|---|---|---|---|
| Previous Owner | North Main Condos Llc | $2,605,292 |
Source: Public Records
Tax History Compared to Growth
Tax History
| Year | Tax Paid | Tax Assessment Tax Assessment Total Assessment is a certain percentage of the fair market value that is determined by local assessors to be the total taxable value of land and additions on the property. | Land | Improvement |
|---|---|---|---|---|
| 2025 | $15,069 | $731,780 | $731,780 | -- |
| 2024 | $15,069 | $731,780 | $731,780 | -- |
| 2023 | $15,069 | $731,780 | $731,780 | $0 |
| 2022 | $11,603 | $526,959 | $501,792 | $25,167 |
| 2021 | $12,366 | $530,592 | $501,792 | $28,800 |
| 2020 | $9,212 | $0 | $0 | $0 |
| 2019 | $9,626 | $380,414 | $367,008 | $13,406 |
| 2018 | $9,033 | $356,958 | $344,070 | $12,888 |
| 2017 | $9,026 | $356,958 | $344,070 | $12,888 |
| 2016 | $6,190 | $244,801 | $244,601 | $200 |
| 2015 | -- | $0 | $0 | $0 |
| 2014 | -- | $0 | $0 | $0 |
Source: Public Records
Map
Nearby Homes