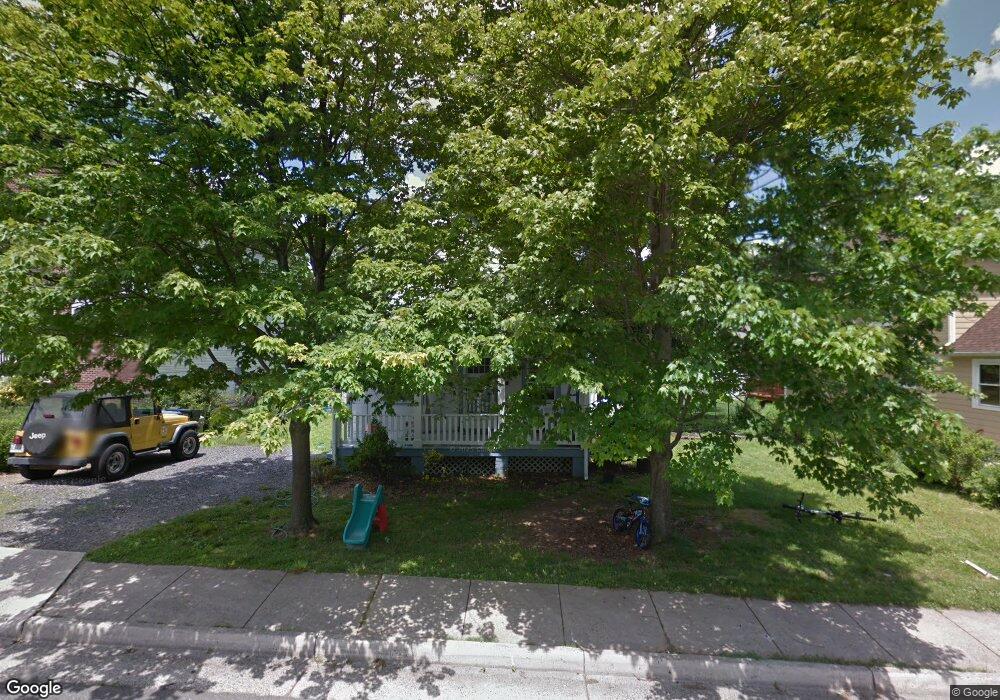
6706 Osborn St Falls Church, VA 22046
Estimated Value: $945,000 - $1,101,007
3
Beds
2
Baths
1,035
Sq Ft
$979/Sq Ft
Est. Value
About This Home
This home is located at 6706 Osborn St, Falls Church, VA 22046 and is currently estimated at $1,013,502, approximately $979 per square foot. 6706 Osborn St is a home located in Fairfax County with nearby schools including Haycock Elementary School, Longfellow Middle School, and St. James Catholic School.
Ownership History
Date
Name
Owned For
Owner Type
Purchase Details
Closed on
Oct 23, 1995
Sold by
Rowland Norman L
Bought by
Thompson Carol G
Current Estimated Value
Home Financials for this Owner
Home Financials are based on the most recent Mortgage that was taken out on this home.
Original Mortgage
$153,630
Outstanding Balance
$1,078
Interest Rate
7.6%
Estimated Equity
$1,012,424
Create a Home Valuation Report for This Property
The Home Valuation Report is an in-depth analysis detailing your home's value as well as a comparison with similar homes in the area
Home Values in the Area
Average Home Value in this Area
Purchase History
| Date | Buyer | Sale Price | Title Company |
|---|---|---|---|
| Thompson Carol G | $156,000 | -- |
Source: Public Records
Mortgage History
| Date | Status | Borrower | Loan Amount |
|---|---|---|---|
| Open | Thompson Carol G | $153,630 |
Source: Public Records
Tax History Compared to Growth
Tax History
| Year | Tax Paid | Tax Assessment Tax Assessment Total Assessment is a certain percentage of the fair market value that is determined by local assessors to be the total taxable value of land and additions on the property. | Land | Improvement |
|---|---|---|---|---|
| 2025 | $10,007 | $867,210 | $541,000 | $326,210 |
| 2024 | $10,007 | $846,940 | $541,000 | $305,940 |
| 2023 | $9,278 | $805,770 | $501,000 | $304,770 |
| 2022 | $8,676 | $743,760 | $443,000 | $300,760 |
| 2021 | $8,527 | $712,630 | $443,000 | $269,630 |
| 2020 | $8,345 | $691,670 | $434,000 | $257,670 |
| 2019 | $7,686 | $637,030 | $434,000 | $203,030 |
| 2018 | $7,130 | $620,030 | $417,000 | $203,030 |
| 2017 | $6,773 | $572,060 | $417,000 | $155,060 |
| 2016 | $6,599 | $558,520 | $405,000 | $153,520 |
| 2015 | $6,078 | $533,620 | $386,000 | $147,620 |
| 2014 | $6,029 | $530,460 | $386,000 | $144,460 |
Source: Public Records
Map
Nearby Homes
- 6712 Moly Dr
- 6703 Hallwood Ave
- 6616 Fisher Ave
- 6613 Fisher Ave
- 2300 Meridian St
- 2221 Orchid Dr
- 2202 Grayson Place
- 6601 Gordon Ave
- 2240 Highland Terrace
- 6927 Haycock Rd
- 2302 Westmoreland St
- 6610 Quinten St
- 6940 Spruce St
- 6616 Kirby Ct
- 6609 Rockmont Ct
- 6990 Falls Reach Dr Unit 313
- 2118 Greenwich St
- 2125 Hilltop Place
- 6956 Birch St
- 2231 N Tuckahoe St
- 6704 Osborn St
- 6708 Osborn St
- 6702 Osborn St
- 2233 Casemont Dr
- 6710 Osborn St
- 2235 Casemont Dr
- 2231 Casemont Dr
- 6700 Osborn St
- 2237 Casemont Dr
- 6707 Osborn St
- 6705 Osborn St
- 6709 Osborn St
- 6712 Osborn St
- 2229 Casemont Dr
- 6703 Osborn St
- 6711 Osborn St
- 6646 Osborn St
- 6701 Osborn St
- 2232 Casemont Dr
- 2234 Casemont Dr