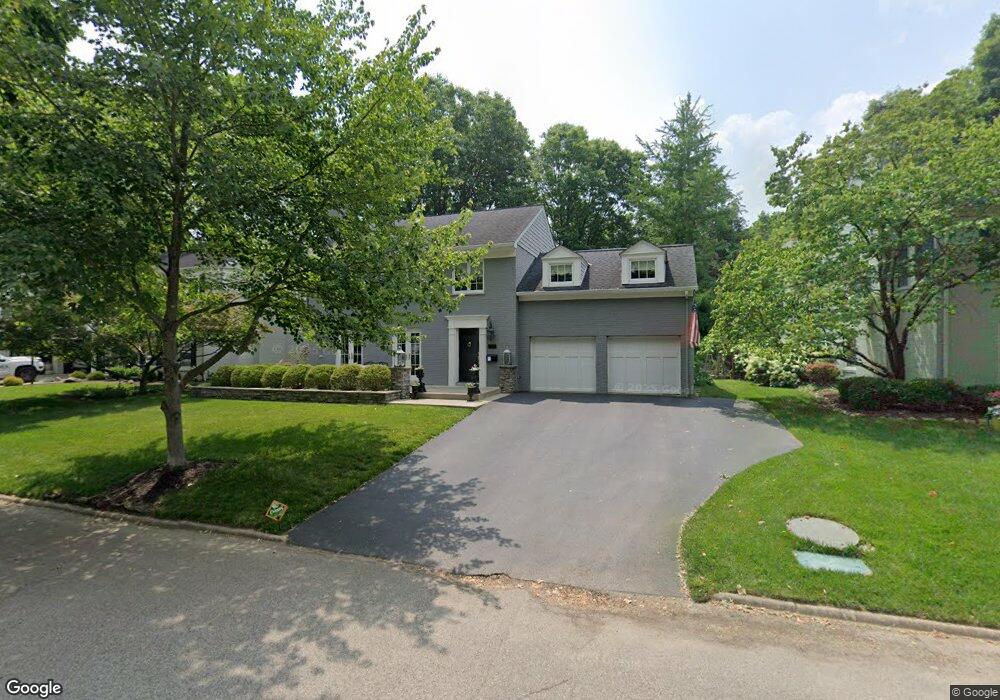
6707 Hammerstone Way Cincinnati, OH 45227
Estimated Value: $1,081,202 - $1,427,000
4
Beds
3
Baths
3,133
Sq Ft
$387/Sq Ft
Est. Value
About This Home
This home is located at 6707 Hammerstone Way, Cincinnati, OH 45227 and is currently estimated at $1,213,051, approximately $387 per square foot. 6707 Hammerstone Way is a home located in Hamilton County with nearby schools including Terrace Park Elementary School, Mariemont Elementary School, and Mariemont High School.
Ownership History
Date
Name
Owned For
Owner Type
Purchase Details
Closed on
Mar 31, 2011
Sold by
Naomi Real Estate Investments Corporatio
Bought by
Kelly Ginger G and Kelly Brian W
Current Estimated Value
Home Financials for this Owner
Home Financials are based on the most recent Mortgage that was taken out on this home.
Original Mortgage
$248,400
Outstanding Balance
$172,888
Interest Rate
4.99%
Mortgage Type
Unknown
Estimated Equity
$1,040,163
Purchase Details
Closed on
Mar 14, 2008
Sold by
Flessa Sabine
Bought by
Naomi Real Estate Investments Corp
Purchase Details
Closed on
Sep 20, 1995
Sold by
Ruess Susan C
Bought by
Macwatt Alexander B and Macwatt Elaine P
Purchase Details
Closed on
Sep 19, 1995
Sold by
Sturtz Pamela C
Bought by
Macwatt Alexander B and Macwatt Elaine P
Create a Home Valuation Report for This Property
The Home Valuation Report is an in-depth analysis detailing your home's value as well as a comparison with similar homes in the area
Home Values in the Area
Average Home Value in this Area
Purchase History
| Date | Buyer | Sale Price | Title Company |
|---|---|---|---|
| Kelly Ginger G | $414,000 | Attorney | |
| Naomi Real Estate Investments Corp | -- | Attorney | |
| Macwatt Alexander B | -- | -- | |
| Macwatt Alexander B | -- | -- |
Source: Public Records
Mortgage History
| Date | Status | Borrower | Loan Amount |
|---|---|---|---|
| Open | Kelly Ginger G | $248,400 |
Source: Public Records
Tax History Compared to Growth
Tax History
| Year | Tax Paid | Tax Assessment Tax Assessment Total Assessment is a certain percentage of the fair market value that is determined by local assessors to be the total taxable value of land and additions on the property. | Land | Improvement |
|---|---|---|---|---|
| 2024 | $20,849 | $302,968 | $108,497 | $194,471 |
| 2023 | $19,230 | $302,968 | $108,497 | $194,471 |
| 2022 | $22,380 | $298,691 | $87,343 | $211,348 |
| 2021 | $21,845 | $298,691 | $87,343 | $211,348 |
| 2020 | $22,068 | $298,691 | $87,343 | $211,348 |
| 2019 | $21,218 | $262,007 | $76,615 | $185,392 |
| 2018 | $21,209 | $262,007 | $76,615 | $185,392 |
| 2017 | $18,050 | $262,007 | $76,615 | $185,392 |
| 2016 | $15,049 | $216,238 | $64,838 | $151,400 |
| 2015 | $15,209 | $216,238 | $64,838 | $151,400 |
| 2014 | $15,042 | $213,672 | $64,838 | $148,834 |
| 2013 | $13,098 | $195,199 | $59,483 | $135,716 |
Source: Public Records
Map
Nearby Homes
- 6576 Wooster Pike
- 3662 Birkdale Ln
- 3670 Birkdale Ln
- 3674 Birkdale Ln
- 3645 Birkdale Ln
- 3690 Birkdale Ln
- St Martin Plan at Birkdale
- 3812 Carlton St
- 6949 Cambridge Ave
- 3809 Petoskey Ave
- 3825 Petoskey Ave
- 3746 Miami Run
- 3763 Miami Run
- 3767 Miami Run
- 3750 Miami Run
- 6219 Bedford St
- 3758 Miami Run
- 3766 Miami Run
- 3754 Miami Run
- 3762 Miami Run
- 6709 Hammerstone Way
- 6705 Pleasant St
- 6710 Miami Bluff Dr
- 6713 Hammerstone Way
- 6703 Pleasant St
- 6708 Miami Bluff Dr
- 6712 Miami Bluff Dr
- 6714 Miami Bluff Dr
- 6716 Hammerstone Way
- 6624 Pleasant St
- 6715 Hammerstone Way
- 6704 Miami Bluff Dr
- 6626 Pleasant St
- 6716 Miami Bluff Dr
- 6622 Pleasant St
- 6717 Hammerstone Way
- 6623 Mariemont Ave
- 6718 Hammerstone Way
- 6625 Mariemont Ave
- 6704 Pleasant St