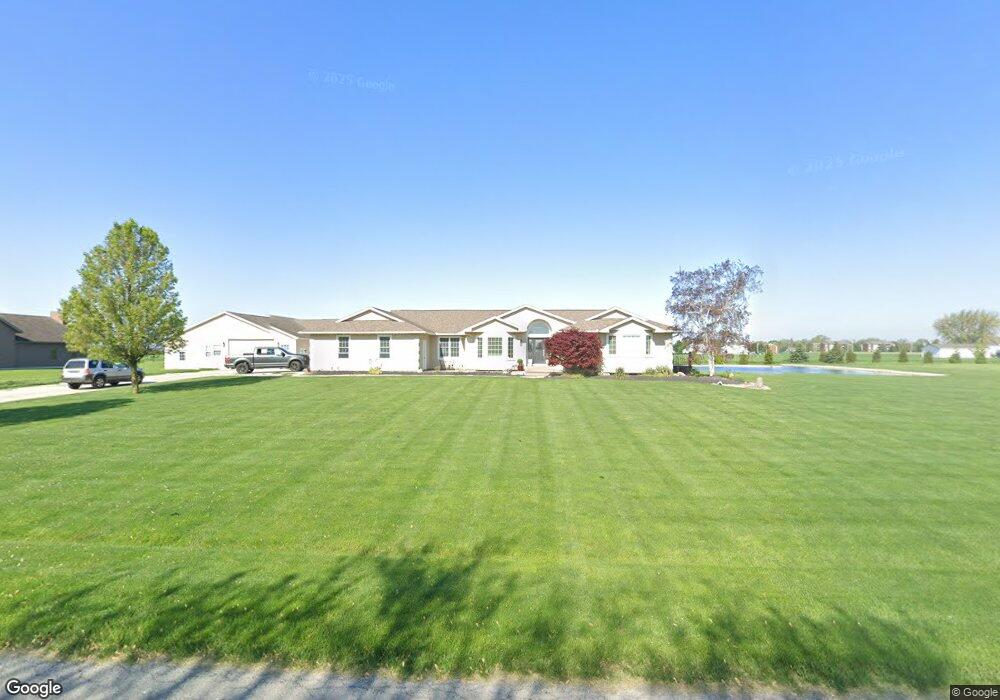
6707 Kiggins Rd Delphos, OH 45833
Estimated Value: $243,000 - $621,447
3
Beds
3
Baths
2,369
Sq Ft
$192/Sq Ft
Est. Value
About This Home
This home is located at 6707 Kiggins Rd, Delphos, OH 45833 and is currently estimated at $453,816, approximately $191 per square foot. 6707 Kiggins Rd is a home located in Allen County with nearby schools including Delphos St. John's High School and Delphos St. John's Elementary School.
Ownership History
Date
Name
Owned For
Owner Type
Purchase Details
Closed on
Apr 2, 2024
Sold by
Dancer Shawn M
Bought by
Shawn M Dancer Living Trust and Dancer
Current Estimated Value
Purchase Details
Closed on
Mar 6, 2006
Sold by
Pohlman L Denise
Bought by
Dancer Shawn M
Home Financials for this Owner
Home Financials are based on the most recent Mortgage that was taken out on this home.
Original Mortgage
$20,285
Interest Rate
6.38%
Mortgage Type
Future Advance Clause Open End Mortgage
Purchase Details
Closed on
Mar 28, 2005
Sold by
Pohlman L Denise
Bought by
Parsons Mitchell A and Parsons Stephanie L
Home Financials for this Owner
Home Financials are based on the most recent Mortgage that was taken out on this home.
Original Mortgage
$30,600
Interest Rate
5.64%
Mortgage Type
Future Advance Clause Open End Mortgage
Create a Home Valuation Report for This Property
The Home Valuation Report is an in-depth analysis detailing your home's value as well as a comparison with similar homes in the area
Home Values in the Area
Average Home Value in this Area
Purchase History
| Date | Buyer | Sale Price | Title Company |
|---|---|---|---|
| Shawn M Dancer Living Trust | -- | None Listed On Document | |
| Dancer Shawn M | $34,000 | None Available | |
| Parsons Mitchell A | $34,000 | None Available |
Source: Public Records
Mortgage History
| Date | Status | Borrower | Loan Amount |
|---|---|---|---|
| Previous Owner | Dancer Shawn M | $20,285 | |
| Previous Owner | Parsons Mitchell A | $30,600 |
Source: Public Records
Tax History
| Year | Tax Paid | Tax Assessment Tax Assessment Total Assessment is a certain percentage of the fair market value that is determined by local assessors to be the total taxable value of land and additions on the property. | Land | Improvement |
|---|---|---|---|---|
| 2024 | $5,731 | $183,200 | $17,120 | $166,080 |
| 2023 | $4,742 | $142,000 | $13,270 | $128,730 |
| 2022 | $4,700 | $138,890 | $12,710 | $126,180 |
| 2021 | $4,723 | $138,890 | $12,710 | $126,180 |
| 2020 | $3,819 | $116,340 | $12,530 | $103,810 |
| 2019 | $3,819 | $116,340 | $12,530 | $103,810 |
| 2018 | $3,668 | $116,340 | $12,530 | $103,810 |
| 2017 | $3,537 | $106,890 | $12,530 | $94,360 |
| 2016 | $2,941 | $88,970 | $12,530 | $76,440 |
| 2015 | $2,392 | $88,970 | $12,530 | $76,440 |
| 2014 | $2,392 | $71,270 | $11,520 | $59,750 |
| 2013 | $2,394 | $71,270 | $11,520 | $59,750 |
Source: Public Records
Map
Nearby Homes
- 7110 Elida Rd
- 310 E Suthoff St
- 483 S Franklin St
- 827 S Washington St
- 821 E 3rd St
- 424 S Canal St
- 221 S Main St
- 241 King St
- 405 N Franklin St
- 420 S Cass St
- 201 E 5th St
- 1000 Colettas Way
- 704 N Franklin St
- 610 N Washington St
- 629 N Main St
- 702 N Main St
- 708 W 1st St
- 409 N Bredeick St
- 709 W 4th St
- 6800 N Defiance Trail
Your Personal Tour Guide
Ask me questions while you tour the home.