Estimated Value: $217,068 - $256,000
3
Beds
1
Bath
1,104
Sq Ft
$215/Sq Ft
Est. Value
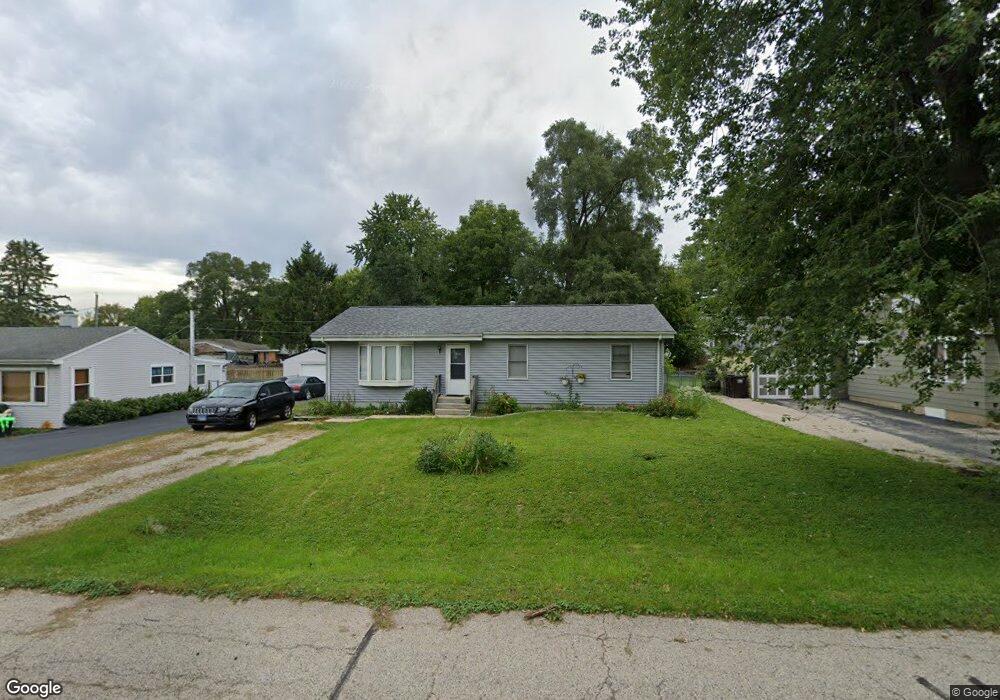
About This Home
This home is located at 6708 Hunters Path, Cary, IL 60013 and is currently estimated at $237,267, approximately $214 per square foot. 6708 Hunters Path is a home located in McHenry County with nearby schools including Deer Path Elementary School, Cary Jr High School, and Cary-Grove High School.
Ownership History
Date
Name
Owned For
Owner Type
Purchase Details
Closed on
Oct 15, 2004
Sold by
Lee Derek G and Lee Rebecca M
Bought by
Hanus Kathryn M
Current Estimated Value
Home Financials for this Owner
Home Financials are based on the most recent Mortgage that was taken out on this home.
Original Mortgage
$140,000
Outstanding Balance
$63,372
Interest Rate
4.5%
Mortgage Type
Unknown
Estimated Equity
$173,895
Purchase Details
Closed on
Jun 1, 2001
Sold by
Diersen Jon M and Diersen Kimberly A
Bought by
Lee Derek G and Miller Rebecca M
Home Financials for this Owner
Home Financials are based on the most recent Mortgage that was taken out on this home.
Original Mortgage
$112,250
Interest Rate
7.23%
Purchase Details
Closed on
Jun 6, 2000
Sold by
Hoppe Kimberly A and Diersen Kimberly A
Bought by
Diersen Jon A and Diersen Kimberley A
Purchase Details
Closed on
Jun 17, 1998
Sold by
Coats Howard D and Coats Lisa J
Bought by
Hoppe Kimberly A
Home Financials for this Owner
Home Financials are based on the most recent Mortgage that was taken out on this home.
Original Mortgage
$87,900
Interest Rate
7.27%
Create a Home Valuation Report for This Property
The Home Valuation Report is an in-depth analysis detailing your home's value as well as a comparison with similar homes in the area
Home Values in the Area
Average Home Value in this Area
Purchase History
| Date | Buyer | Sale Price | Title Company |
|---|---|---|---|
| Hanus Kathryn M | $160,000 | Heritage Title Company | |
| Lee Derek G | $125,250 | -- | |
| Diersen Jon A | -- | -- | |
| Hoppe Kimberly A | $110,000 | -- |
Source: Public Records
Mortgage History
| Date | Status | Borrower | Loan Amount |
|---|---|---|---|
| Open | Hanus Kathryn M | $140,000 | |
| Previous Owner | Lee Derek G | $112,250 | |
| Previous Owner | Hoppe Kimberly A | $87,900 |
Source: Public Records
Tax History
| Year | Tax Paid | Tax Assessment Tax Assessment Total Assessment is a certain percentage of the fair market value that is determined by local assessors to be the total taxable value of land and additions on the property. | Land | Improvement |
|---|---|---|---|---|
| 2024 | $4,314 | $67,049 | $10,005 | $57,044 |
| 2023 | $4,189 | $59,967 | $8,948 | $51,019 |
| 2022 | $3,844 | $52,983 | $10,359 | $42,624 |
| 2021 | $3,647 | $49,360 | $9,651 | $39,709 |
| 2020 | $3,528 | $47,612 | $9,309 | $38,303 |
| 2019 | $3,449 | $45,571 | $8,910 | $36,661 |
| 2018 | $2,895 | $38,390 | $8,231 | $30,159 |
| 2017 | $2,821 | $36,166 | $7,754 | $28,412 |
| 2016 | $2,783 | $33,921 | $7,273 | $26,648 |
| 2013 | -- | $32,872 | $6,784 | $26,088 |
Source: Public Records
Map
Nearby Homes
- 6606 Silver Lake Rd
- 317 Sterling Cir
- 6305 Robert Rd
- 2819 Sun Valley Dr
- 5 Echo Hill Rd
- 237 Foxford Dr
- 16 Ash Dr
- 331 Parkstone Dr
- Lot 10 Grove Ln
- Lot 11 Grove Ln
- LOT 02 Three Oaks Rd
- 203 Valley Dr
- 211 Woody Way
- 134 Bright Oaks Cir
- 3408 Royal Woods Dr
- 1141 Westlake Dr
- 717 Wellington Ln
- 392 W Margaret Terrace
- 1161 Amber Dr
- 12 Oak Valley Dr
- 6710 Hunters Path
- 6709 Hawthorne Dr
- 6705 Hawthorne Dr Unit 1
- 6704 Hunters Path
- 6712 Hunters Path
- 6707 Hunters Path
- 6711 Hawthorne Dr
- 6709 Hunters Path
- 6705 Hunters Path Unit 1
- 6702 Hunters Path
- 6714 Hunters Path
- 6711 Hunters Path
- 6713 Hawthorne Dr
- 6703 Hawthorne Dr
- 6703 Hunters Path
- 6713 Hunters Path
- 6716 Hunters Path
- 6708 Wander Way
- 6706 Wander Way
- 6710 Wander Way
Your Personal Tour Guide
Ask me questions while you tour the home.