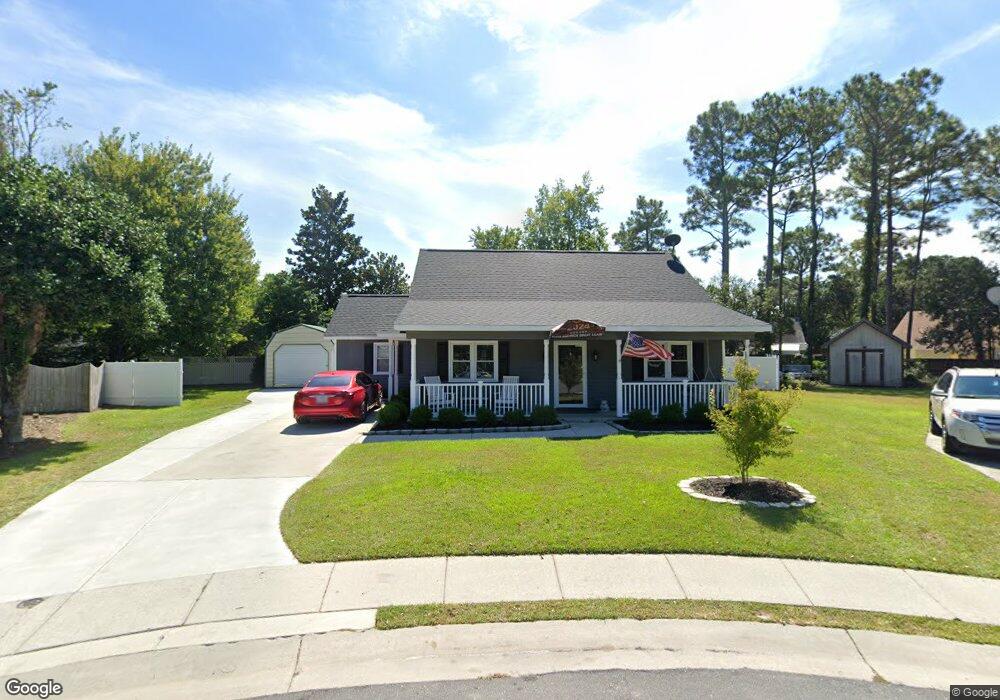
6708 Rushwood Ct Wilmington, NC 28405
Estimated Value: $304,000 - $371,000
3
Beds
2
Baths
1,550
Sq Ft
$222/Sq Ft
Est. Value
About This Home
This home is located at 6708 Rushwood Ct, Wilmington, NC 28405 and is currently estimated at $343,644, approximately $221 per square foot. 6708 Rushwood Ct is a home located in New Hanover County with nearby schools including John J. Blair Elementary School, Emma B. Trask Middle School, and New Hanover High School.
Ownership History
Date
Name
Owned For
Owner Type
Purchase Details
Closed on
Aug 6, 2001
Sold by
Konrady Mary E Ronald E
Bought by
Leonard Jeffery D Kimberly S
Current Estimated Value
Purchase Details
Closed on
Apr 26, 1995
Sold by
Kanakry Mark Edward Lynn S
Bought by
Cass Mary Elizabeth
Purchase Details
Closed on
Aug 3, 1993
Sold by
Teachey John Kevin
Bought by
Kanakry Mark Edward Lynn S
Purchase Details
Closed on
Apr 13, 1993
Sold by
Teachey Amber H
Bought by
Teachey John Kevin
Purchase Details
Closed on
Apr 10, 1992
Sold by
Altman Timothy W Sandra
Bought by
Teachey John Kevin Amber
Purchase Details
Closed on
Jul 28, 1989
Sold by
Landmark Organization Inc
Bought by
Altman Timothy W Sandra W
Purchase Details
Closed on
May 31, 1989
Sold by
Landmark Organization Inc
Bought by
Altman Timothy W Sandra W
Create a Home Valuation Report for This Property
The Home Valuation Report is an in-depth analysis detailing your home's value as well as a comparison with similar homes in the area
Home Values in the Area
Average Home Value in this Area
Purchase History
| Date | Buyer | Sale Price | Title Company |
|---|---|---|---|
| Leonard Jeffery D Kimberly S | $100,000 | -- | |
| Cass Mary Elizabeth | $83,000 | -- | |
| Kanakry Mark Edward Lynn S | $76,000 | -- | |
| Teachey John Kevin | -- | -- | |
| Teachey John Kevin Amber | $73,000 | -- | |
| Altman Timothy W Sandra W | $30,300 | -- | |
| Altman Timothy W Sandra W | $264,000 | -- | |
| Landmark Organization Inc | -- | -- |
Source: Public Records
Tax History Compared to Growth
Tax History
| Year | Tax Paid | Tax Assessment Tax Assessment Total Assessment is a certain percentage of the fair market value that is determined by local assessors to be the total taxable value of land and additions on the property. | Land | Improvement |
|---|---|---|---|---|
| 2025 | $878 | $335,200 | $110,900 | $224,300 |
| 2024 | $878 | $209,900 | $67,300 | $142,600 |
| 2023 | $550 | $197,500 | $67,300 | $130,200 |
| 2022 | $832 | $197,500 | $67,300 | $130,200 |
| 2021 | $547 | $197,500 | $67,300 | $130,200 |
| 2020 | $923 | $145,900 | $42,000 | $103,900 |
| 2019 | $896 | $141,600 | $42,000 | $99,600 |
| 2018 | $896 | $141,600 | $42,000 | $99,600 |
| 2017 | $917 | $141,600 | $42,000 | $99,600 |
| 2016 | $847 | $122,200 | $40,000 | $82,200 |
| 2015 | $787 | $122,200 | $40,000 | $82,200 |
| 2014 | $774 | $122,200 | $40,000 | $82,200 |
Source: Public Records
Map
Nearby Homes
- 1915 Daniel Boone Trail
- 6331 Gordon Rd
- 6329 Gordon Rd
- 1911 Daniel Boone Trail
- 508 N Green Meadows Dr
- 209 Olde Well Loop Rd
- 601 High Bush Ct
- 26 Station Rd
- 733 Bracken Fern Dr
- 6110 Gordon Rd
- 102 Albemarle Rd
- 110 Edwards St
- 606 Fitzgerald Dr
- 210 Spartan Rd
- 5202 Fitzgerald Dr
- 207 Green Meadows Dr
- 1009 Fitzgerald Dr
- 811 Bay Blossom Dr
- 2213 White Rd
- 304 Halyard Ct
- 6706 Rushwood Ct
- 6707 Rushwood Ct
- 6717 Emberwood Rd
- 6715 Emberwood Rd
- 6719 Emberwood Rd
- 6713 Emberwood Rd
- 6705 Rushwood Ct
- 6704 Rushwood Ct
- 6711 Emberwood Rd
- 6709 Emberwood Rd
- 6721 Emberwood Rd
- 6707 Emberwood Rd
- 6703 Rushwood Ct
- 6702 Rushwood Ct
- 6705 Emberwood Rd
- 6723 Emberwood Rd
- 6722 Emberwood Rd
- 6720 Emberwood Rd
- 6718 Emberwood Rd
- 6716 Emberwood Rd