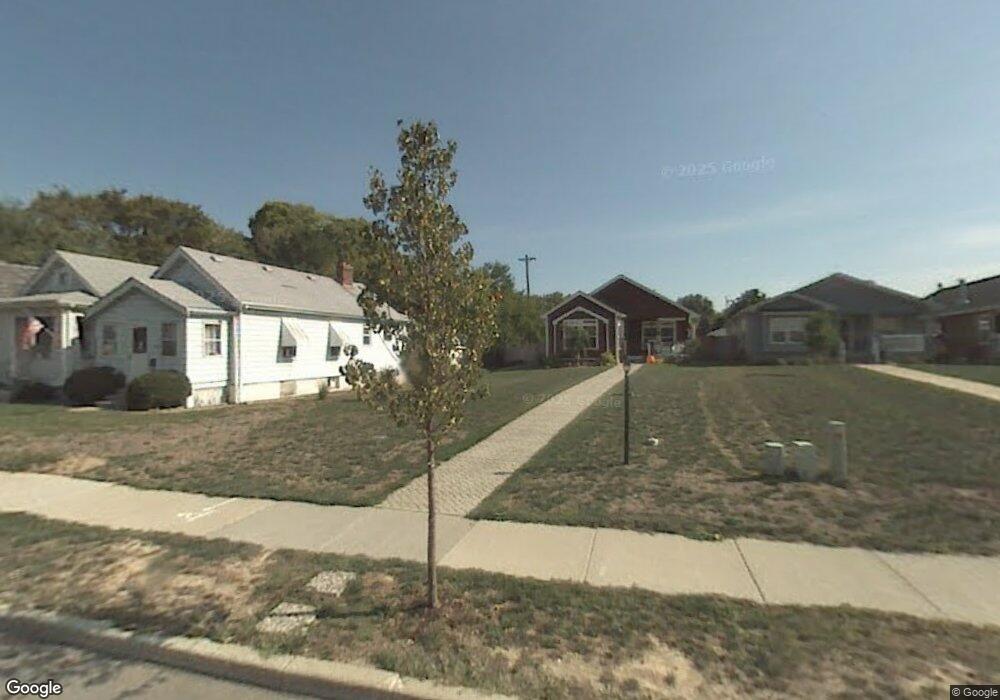
6708 Van Kirk Ave Cincinnati, OH 45216
Carthage NeighborhoodEstimated Value: $206,000 - $279,000
3
Beds
2
Baths
1,871
Sq Ft
$122/Sq Ft
Est. Value
About This Home
This home is located at 6708 Van Kirk Ave, Cincinnati, OH 45216 and is currently estimated at $228,749, approximately $122 per square foot. 6708 Van Kirk Ave is a home located in Hamilton County with nearby schools including Rising Stars at Carthage, Hartwell School, and Shroder High School.
Ownership History
Date
Name
Owned For
Owner Type
Purchase Details
Closed on
Mar 3, 2023
Sold by
Thorman Trust
Bought by
Whitney Kyle A and Caviness Blair N
Current Estimated Value
Home Financials for this Owner
Home Financials are based on the most recent Mortgage that was taken out on this home.
Original Mortgage
$160,807
Outstanding Balance
$154,747
Interest Rate
6.32%
Mortgage Type
FHA
Estimated Equity
$74,002
Purchase Details
Closed on
Dec 9, 2019
Sold by
Thorman Kathleen
Bought by
Thompson Suzanne and The Thorman Trust
Purchase Details
Closed on
Nov 14, 2005
Sold by
Potterhill Homes Llc
Bought by
Thorman Kathleen and Campbell James A
Home Financials for this Owner
Home Financials are based on the most recent Mortgage that was taken out on this home.
Original Mortgage
$181,777
Interest Rate
6.36%
Mortgage Type
FHA
Purchase Details
Closed on
Apr 21, 2004
Sold by
City Of Cincinnati
Bought by
Potterhill Homes Llc
Create a Home Valuation Report for This Property
The Home Valuation Report is an in-depth analysis detailing your home's value as well as a comparison with similar homes in the area
Home Values in the Area
Average Home Value in this Area
Purchase History
| Date | Buyer | Sale Price | Title Company |
|---|---|---|---|
| Whitney Kyle A | $163,775 | None Listed On Document | |
| Thompson Suzanne | $132,000 | American Homeland Title | |
| Thorman Kathleen | -- | Springdale Title Agency Llc | |
| Potterhill Homes Llc | -- | -- |
Source: Public Records
Mortgage History
| Date | Status | Borrower | Loan Amount |
|---|---|---|---|
| Open | Whitney Kyle A | $160,807 | |
| Previous Owner | Thorman Kathleen | $181,777 |
Source: Public Records
Tax History
| Year | Tax Paid | Tax Assessment Tax Assessment Total Assessment is a certain percentage of the fair market value that is determined by local assessors to be the total taxable value of land and additions on the property. | Land | Improvement |
|---|---|---|---|---|
| 2025 | $3,553 | $57,323 | $10,500 | $46,823 |
| 2023 | $3,525 | $57,323 | $10,500 | $46,823 |
| 2022 | $3,170 | $46,200 | $6,090 | $40,110 |
| 2021 | $3,052 | $46,200 | $6,090 | $40,110 |
| 2020 | $575 | $46,200 | $6,090 | $40,110 |
| 2019 | $402 | $29,425 | $5,250 | $24,175 |
| 2018 | $387 | $29,425 | $5,250 | $24,175 |
| 2017 | $368 | $29,425 | $5,250 | $24,175 |
| 2016 | $695 | $54,828 | $9,790 | $45,038 |
| 2015 | $627 | $54,828 | $9,790 | $45,038 |
| 2014 | $631 | $54,828 | $9,790 | $45,038 |
| 2013 | $684 | $58,328 | $10,416 | $47,912 |
Source: Public Records
Map
Nearby Homes
- 206 W 69th St
- 107 W Sixty Fifth St
- 121 64th St
- 6605 Hasler Ln
- 6310 Vine St
- 524 Maple St
- 1 Spruce St
- 412 Walnut St
- 120 W Seventy Second St
- 302 Walnut St
- 3 W 73rd St
- 215 Walnut St
- 5914 Elmwood Ave
- 118 W North Bend Rd
- 14 Township Ave
- 0 Township Road 111
- 1139 Towanda Terrace
- 1117 W Seymour Ave
- 1100 Carolina Ave
- 1522 Kenova Ave
- 6706 Van Kirk Ave
- 6704 Van Kirk Ave
- 6712 Van Kirk Ave
- 6710 Van Kirk Ave
- 6659 Fairpark Ave
- 6714 Van Kirk Ave
- 6716 Van Kirk Ave
- 6702 Van Kirk Ave
- 6700 Van Kirk Ave
- 6653 Fairpark Ave
- 6649 Fairpark Ave
- 125 W 68th St
- 117 W 68th St
- 6645 Fairpark Ave
- 121 W 68th St
- 6696 Van Kirk Ave
- 127 W 68th St
- 119 W 68th St
- 113 W 68th St
- 123 W 68th St
Your Personal Tour Guide
Ask me questions while you tour the home.