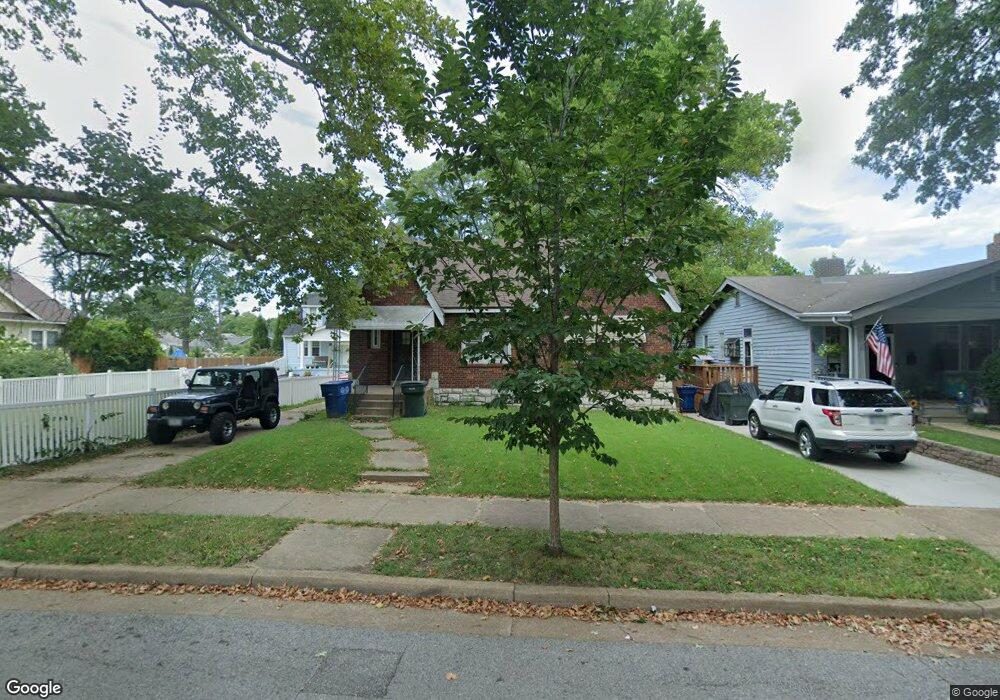
6709 Hancock Ave Saint Louis, MO 63139
Lindenwood Park NeighborhoodEstimated Value: $211,922 - $278,000
--
Bed
1
Bath
2,014
Sq Ft
$120/Sq Ft
Est. Value
About This Home
This home is located at 6709 Hancock Ave, Saint Louis, MO 63139 and is currently estimated at $242,481, approximately $120 per square foot. 6709 Hancock Ave is a home located in St. Louis City with nearby schools including Mason Elementary School, Long International Middle School, and Roosevelt High School.
Ownership History
Date
Name
Owned For
Owner Type
Purchase Details
Closed on
Nov 7, 2012
Sold by
Pierson Norman R and Pierson Steven J
Bought by
Pierson Steven J
Current Estimated Value
Home Financials for this Owner
Home Financials are based on the most recent Mortgage that was taken out on this home.
Original Mortgage
$135,068
Outstanding Balance
$98,911
Interest Rate
4.7%
Mortgage Type
Adjustable Rate Mortgage/ARM
Estimated Equity
$143,570
Purchase Details
Closed on
Feb 11, 2005
Sold by
Mcdonald Anne
Bought by
Pierson Norman R and Pierson Steven J
Home Financials for this Owner
Home Financials are based on the most recent Mortgage that was taken out on this home.
Original Mortgage
$135,611
Interest Rate
5.68%
Mortgage Type
Purchase Money Mortgage
Purchase Details
Closed on
Jan 14, 2005
Sold by
Forthaus Leonard
Bought by
Saaman Corp
Home Financials for this Owner
Home Financials are based on the most recent Mortgage that was taken out on this home.
Original Mortgage
$135,611
Interest Rate
5.68%
Mortgage Type
Purchase Money Mortgage
Create a Home Valuation Report for This Property
The Home Valuation Report is an in-depth analysis detailing your home's value as well as a comparison with similar homes in the area
Home Values in the Area
Average Home Value in this Area
Purchase History
| Date | Buyer | Sale Price | Title Company |
|---|---|---|---|
| Pierson Steven J | -- | None Available | |
| Pierson Norman R | -- | U S Title | |
| Mcdonald Anne | -- | U S Title | |
| Saaman Corp | -- | Ort |
Source: Public Records
Mortgage History
| Date | Status | Borrower | Loan Amount |
|---|---|---|---|
| Open | Pierson Steven J | $135,068 | |
| Closed | Saaman Corp | $135,611 |
Source: Public Records
Tax History Compared to Growth
Tax History
| Year | Tax Paid | Tax Assessment Tax Assessment Total Assessment is a certain percentage of the fair market value that is determined by local assessors to be the total taxable value of land and additions on the property. | Land | Improvement |
|---|---|---|---|---|
| 2025 | $2,767 | $38,500 | $3,800 | $34,700 |
| 2024 | $2,632 | $32,720 | $3,800 | $28,920 |
| 2023 | $2,632 | $32,720 | $3,800 | $28,920 |
| 2022 | $2,515 | $30,090 | $3,800 | $26,290 |
| 2021 | $2,512 | $30,090 | $3,800 | $26,290 |
| 2020 | $2,352 | $28,370 | $3,800 | $24,570 |
| 2019 | $2,344 | $28,370 | $3,800 | $24,570 |
| 2018 | $2,146 | $25,150 | $3,380 | $21,770 |
| 2017 | $2,110 | $25,160 | $3,380 | $21,770 |
| 2016 | $1,815 | $21,320 | $3,380 | $17,940 |
| 2015 | $1,646 | $21,320 | $3,380 | $17,940 |
| 2014 | $1,597 | $21,320 | $3,380 | $17,940 |
| 2013 | -- | $20,690 | $3,380 | $17,310 |
Source: Public Records
Map
Nearby Homes
- 6653 Hancock Ave
- 6811 Marquette Ave
- 6625 Hancock Ave
- 6656 Oleatha Ave
- 6631 Pernod Ave
- 6611 Pernod Ave
- 3308 Jamieson Ave
- 6659 Tholozan Ave
- 6621 Tholozan Ave
- 6953 Arthur Ave
- 6523 Fyler Ave
- 3203 Ivanhoe Ave
- 6437 Hancock Ave
- 6517 Tholozan Ave
- 6411 Hancock Ave
- 6541 Lindenwood Place
- 3282 Watson Rd
- 6339 Marquette Ave
- 6568 Smiley Ave
- 6325 Marquette Ave
- 6715 Hancock Ave
- 6705 Hancock Ave
- 3419 Ivanhoe Ave
- 6701 Hancock Ave
- 6721 Hancock Ave
- 6725 Hancock Ave
- 6729 Hancock Ave
- 6708 Arthur Ave
- 6704 Arthur Ave
- 6712 Arthur Ave
- 6700 Arthur Ave
- 6661 Hancock Ave
- 6718 Arthur Ave
- 6704 Hancock Ave
- 6733 Hancock Ave
- 3445 Ivanhoe Ave
- 6708 Hancock Ave
- 6724 Arthur Ave
- 6657 Hancock Ave
- 6714 Hancock Ave