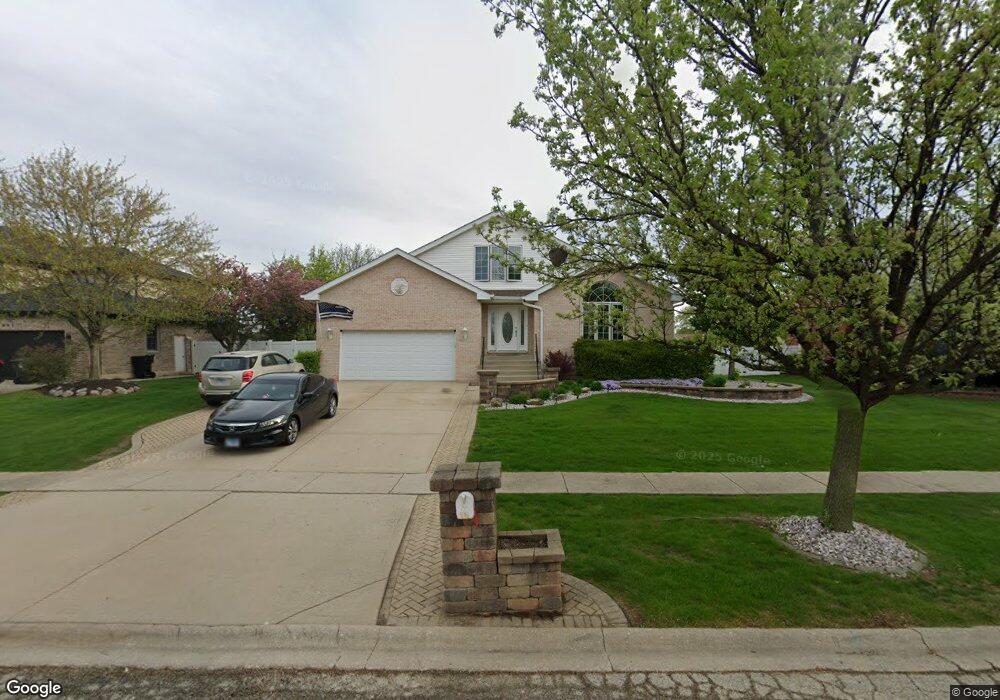
671 Buckboard Dr Unit 1 New Lenox, IL 60451
Estimated Value: $470,000 - $556,000
--
Bed
--
Bath
--
Sq Ft
0.39
Acres
About This Home
This home is located at 671 Buckboard Dr Unit 1, New Lenox, IL 60451 and is currently estimated at $513,000. 671 Buckboard Dr Unit 1 is a home located in Will County with nearby schools including Oster-Oakview School, Haines Elementary School, and Lincoln Way West.
Ownership History
Date
Name
Owned For
Owner Type
Purchase Details
Closed on
Jan 26, 2005
Sold by
Siemeck Brian L and Siemeck Kathy
Bought by
Siemeck Brian Lee and Siemeck Kathy
Current Estimated Value
Purchase Details
Closed on
Jun 9, 2003
Sold by
Widlacki Craig and Widlacki Karen
Bought by
Siemeck Brian L and Siemeck Kathy
Home Financials for this Owner
Home Financials are based on the most recent Mortgage that was taken out on this home.
Original Mortgage
$225,600
Outstanding Balance
$96,885
Interest Rate
5.51%
Mortgage Type
Purchase Money Mortgage
Estimated Equity
$416,115
Purchase Details
Closed on
Feb 15, 2002
Sold by
Lewellen Home Builders Inc
Bought by
Widlacki Craig and Widlacki Karen
Home Financials for this Owner
Home Financials are based on the most recent Mortgage that was taken out on this home.
Original Mortgage
$204,000
Interest Rate
6.92%
Create a Home Valuation Report for This Property
The Home Valuation Report is an in-depth analysis detailing your home's value as well as a comparison with similar homes in the area
Home Values in the Area
Average Home Value in this Area
Purchase History
| Date | Buyer | Sale Price | Title Company |
|---|---|---|---|
| Siemeck Brian Lee | -- | Chicago Title Insurance Co | |
| Siemeck Brian L | $284,000 | -- | |
| Widlacki Craig | $255,000 | Chicago Title Insurance Co |
Source: Public Records
Mortgage History
| Date | Status | Borrower | Loan Amount |
|---|---|---|---|
| Open | Siemeck Brian L | $225,600 | |
| Previous Owner | Widlacki Craig | $204,000 |
Source: Public Records
Tax History Compared to Growth
Tax History
| Year | Tax Paid | Tax Assessment Tax Assessment Total Assessment is a certain percentage of the fair market value that is determined by local assessors to be the total taxable value of land and additions on the property. | Land | Improvement |
|---|---|---|---|---|
| 2024 | $10,657 | $153,809 | $36,940 | $116,869 |
| 2023 | $10,657 | $140,209 | $33,674 | $106,535 |
| 2022 | $10,657 | $129,166 | $31,022 | $98,144 |
| 2021 | $10,120 | $121,476 | $29,175 | $92,301 |
| 2020 | $9,982 | $117,142 | $28,134 | $89,008 |
| 2019 | $9,415 | $113,510 | $27,262 | $86,248 |
| 2018 | $9,199 | $109,598 | $26,323 | $83,275 |
| 2017 | $8,743 | $106,447 | $25,566 | $80,881 |
| 2016 | $8,488 | $103,598 | $24,882 | $78,716 |
| 2015 | $8,179 | $100,337 | $24,099 | $76,238 |
| 2014 | $8,179 | $99,098 | $23,801 | $75,297 |
| 2013 | $8,179 | $100,434 | $24,122 | $76,312 |
Source: Public Records
Map
Nearby Homes
- 1261 S Regan Rd
- 1920 Edmonds Ave
- 208 Redwood Ave
- 200 Redwood Ave
- 807 Picardy Place
- 1344 N Cedar Rd
- 13420 Florence Rd
- Lot 108 S Richard Ave
- 13621 W Maple Rd
- 133 Barbara Ln
- 224 Hauser Ct
- 12001 W Route 6
- Lot 122 S Lynn Pkwy
- 217 Aspen Dr
- 154 Barbara Ln
- 13741 Elizabeth Ln
- 18909 Ruth Dr
- 1108 Plaza Dr
- 0000 W Regan Rd
- 203 Fir St
- 679 Buckboard Dr
- 663 Buckboard Dr
- 1562 Edmond Ave
- 701 Buckboard Dr
- 655 Buckboard Dr
- 678 Wagon Dr
- 1492 Hickory Creek Dr
- 1578 Edmond Ave
- 1493 Hickory Creek Dr Unit 1
- 700 Wagon Dr Unit 3
- 711 Buckboard Dr
- 700 Buckboard Dr
- 1464 Hickory Creek Dr Unit 1
- 710 Wagon Dr
- 1465 Hickory Creek Dr
- 1494 Edmonds Ave
- 1494 Edmond Ave
- 1547 Edmonds Ave
- 1547 Edmond Ave
- 710 Buckboard Dr