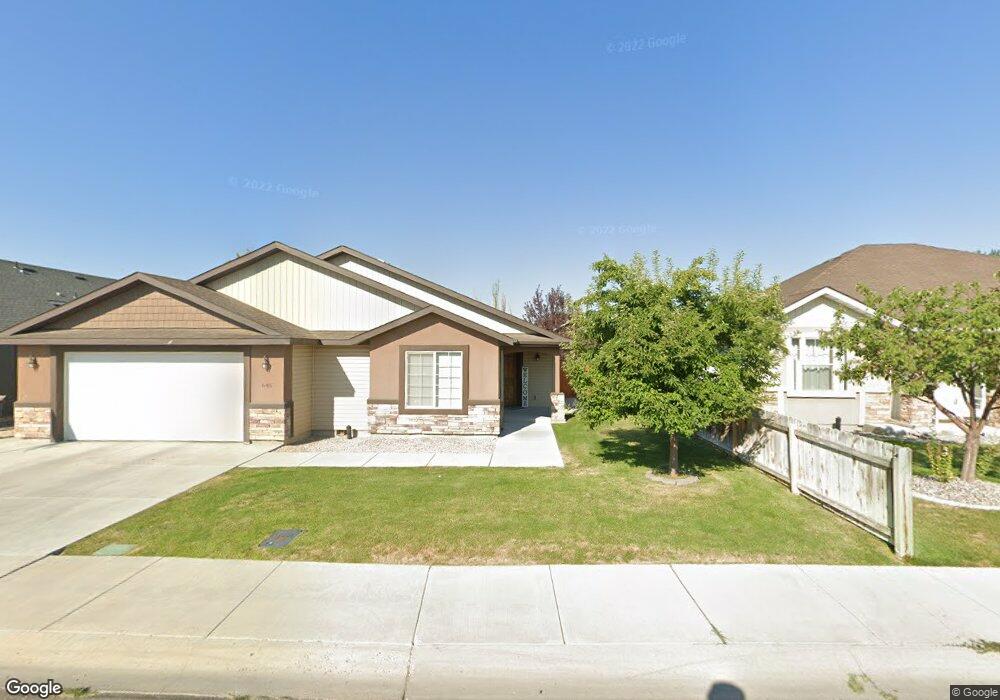
671 Creekside Way Twin Falls, ID 83301
Estimated Value: $547,000 - $663,000
4
Beds
3
Baths
2,574
Sq Ft
$235/Sq Ft
Est. Value
About This Home
This home is located at 671 Creekside Way, Twin Falls, ID 83301 and is currently estimated at $605,005, approximately $235 per square foot. 671 Creekside Way is a home located in Twin Falls County with nearby schools including Rock Creek Elementary School, Robert Stuart Junior High School, and Canyon Ridge High School.
Ownership History
Date
Name
Owned For
Owner Type
Purchase Details
Closed on
Jun 15, 2021
Sold by
Hodge Michael J and Madsen Vicki
Bought by
Madsen Vicki
Current Estimated Value
Home Financials for this Owner
Home Financials are based on the most recent Mortgage that was taken out on this home.
Original Mortgage
$117,100
Outstanding Balance
$87,910
Interest Rate
2.3%
Mortgage Type
New Conventional
Estimated Equity
$517,095
Purchase Details
Closed on
Nov 6, 2012
Sold by
James Ray Inc
Bought by
Hodge Michael J and Madsen Vicki
Home Financials for this Owner
Home Financials are based on the most recent Mortgage that was taken out on this home.
Original Mortgage
$191,764
Interest Rate
3.34%
Mortgage Type
New Conventional
Purchase Details
Closed on
Jan 30, 2006
Sold by
Titlefact Inc
Bought by
Greenridge Development Llc and The Horizon Crest Estates Llc
Create a Home Valuation Report for This Property
The Home Valuation Report is an in-depth analysis detailing your home's value as well as a comparison with similar homes in the area
Home Values in the Area
Average Home Value in this Area
Purchase History
| Date | Buyer | Sale Price | Title Company |
|---|---|---|---|
| Madsen Vicki | -- | Alliance Title | |
| Hodge Michael J | -- | Land Title | |
| James Ray Inc | -- | Land Title | |
| Greenridge Development Llc | -- | Title Fact Inc |
Source: Public Records
Mortgage History
| Date | Status | Borrower | Loan Amount |
|---|---|---|---|
| Open | Madsen Vicki | $117,100 | |
| Closed | James Ray Inc | $191,764 |
Source: Public Records
Tax History Compared to Growth
Tax History
| Year | Tax Paid | Tax Assessment Tax Assessment Total Assessment is a certain percentage of the fair market value that is determined by local assessors to be the total taxable value of land and additions on the property. | Land | Improvement |
|---|---|---|---|---|
| 2024 | $4,182 | $567,696 | $155,028 | $412,668 |
| 2023 | $3,943 | $602,089 | $155,028 | $447,061 |
| 2022 | $5,370 | $593,994 | $70,869 | $523,125 |
| 2021 | $4,905 | $450,783 | $65,338 | $385,445 |
| 2020 | $4,423 | $389,907 | $56,604 | $333,303 |
| 2019 | $4,984 | $378,991 | $56,604 | $322,387 |
| 2018 | $4,530 | $341,899 | $39,765 | $302,134 |
| 2017 | $3,953 | $310,845 | $39,765 | $271,080 |
| 2016 | $3,605 | $274,584 | $0 | $0 |
| 2015 | $3,608 | $274,584 | $39,765 | $234,819 |
| 2012 | -- | $37,671 | $0 | $0 |
Source: Public Records
Map
Nearby Homes
- 1173 Knoll Ridge Rd
- 1171 Glen Brook Rd
- 1128 Wirsching Ave W
- 1016 Arrow Wood Ct
- 1011 Filer Ave W
- 791 Twilight Loop
- 784 Twilight Loop
- 909 Arrow Wood Ct
- 1196 Rd Unit Lot 20 Block 12
- 895 Robbins Ave
- 1207 Frank Henry Rd
- 833 Arrow Wood Ct
- 1170 Frank Henry Rd
- 1253 White Birch Ave
- 977 Kenbrook Loop
- 981 Kenbrook Loop
- 1147 Westwing Way
- 1146 Creekside Way
- 1008 Frank Henry Rd
- 946 Kenbrook Loop
- 675 Creekside Way
- 645 Creekside Way
- 657 Creekside Way
- 635 Creekside Way
- 669 Creekside Way
- 625 Creekside Way
- 1132 Knoll Ridge Rd
- 1242 Knoll Ridge Rd
- 681 Creekside Way
- 615 Creekside Way
- 1237 Knoll Ridge Rd
- B10 L15 Creekside Way
- B10 L16 Creekside Way
- 670 Creekside Way
- 691 Creekside Way
- 607 Creekside Way
- 679 Creekside Way
- 1240 Glenn Brook Rd
- 677 Creekside Way
- 689 Briarcliff Dr