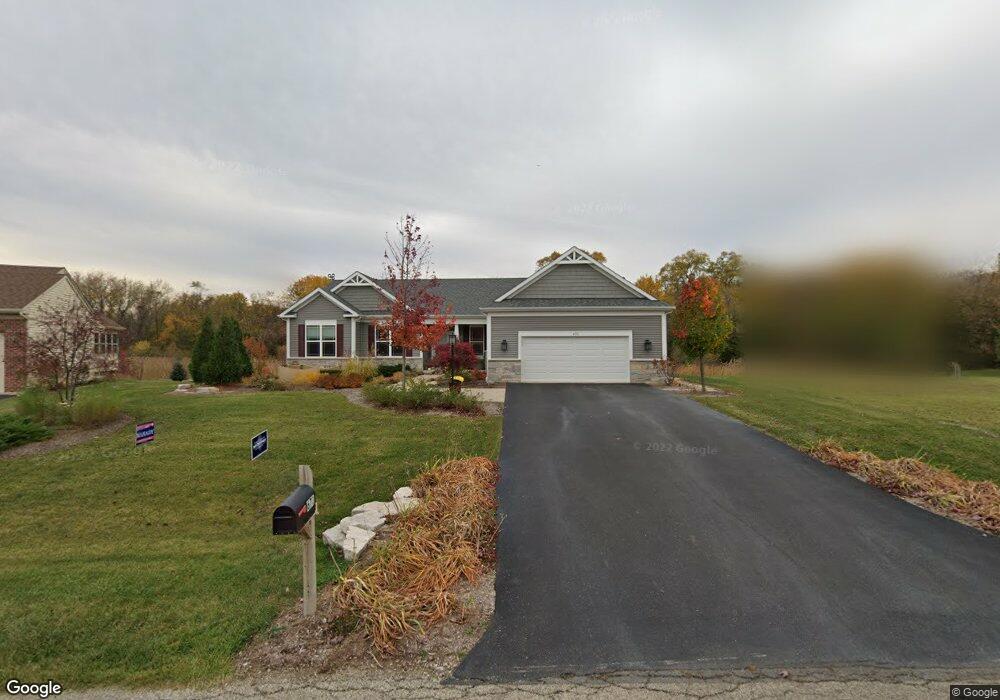
671 Flagg Ln Woodstock, IL 60098
Estimated Value: $459,000 - $630,000
3
Beds
2
Baths
2,006
Sq Ft
$263/Sq Ft
Est. Value
About This Home
This home is located at 671 Flagg Ln, Woodstock, IL 60098 and is currently estimated at $527,774, approximately $263 per square foot. 671 Flagg Ln is a home with nearby schools including Olson Elementary School, Northwood Middle School, and Woodstock North High School.
Ownership History
Date
Name
Owned For
Owner Type
Purchase Details
Closed on
Feb 4, 2025
Sold by
Malmgren Carol E
Bought by
Carol E Malmgren Trust and Malmgren
Current Estimated Value
Purchase Details
Closed on
Dec 12, 2018
Sold by
Klm Builders Inc
Bought by
Malmgren Carol E
Home Financials for this Owner
Home Financials are based on the most recent Mortgage that was taken out on this home.
Original Mortgage
$100,000
Interest Rate
4.25%
Mortgage Type
New Conventional
Purchase Details
Closed on
Jun 29, 2018
Sold by
Fairview Estates Of Woodstock Llc
Bought by
Klm Builders Inc
Purchase Details
Closed on
Sep 27, 2011
Sold by
Falcon Funding Llc
Bought by
Fairview Estates Of Woodstock Llc
Purchase Details
Closed on
Feb 18, 2011
Sold by
Allied Design Build Inc
Bought by
Falcon Funding Llc
Create a Home Valuation Report for This Property
The Home Valuation Report is an in-depth analysis detailing your home's value as well as a comparison with similar homes in the area
Home Values in the Area
Average Home Value in this Area
Purchase History
| Date | Buyer | Sale Price | Title Company |
|---|---|---|---|
| Carol E Malmgren Trust | -- | None Listed On Document | |
| Malmgren Carol E | $367,000 | Heritage Title Co | |
| Klm Builders Inc | $28,500 | Heritage Title Co | |
| Fairview Estates Of Woodstock Llc | -- | None Available | |
| Falcon Funding Llc | $601,000 | None Available |
Source: Public Records
Mortgage History
| Date | Status | Borrower | Loan Amount |
|---|---|---|---|
| Previous Owner | Malmgren Carol E | $100,000 |
Source: Public Records
Tax History Compared to Growth
Tax History
| Year | Tax Paid | Tax Assessment Tax Assessment Total Assessment is a certain percentage of the fair market value that is determined by local assessors to be the total taxable value of land and additions on the property. | Land | Improvement |
|---|---|---|---|---|
| 2024 | $12,250 | $140,958 | $15,078 | $125,880 |
| 2023 | $11,191 | $127,471 | $13,635 | $113,836 |
| 2022 | $10,581 | $113,127 | $12,101 | $101,026 |
| 2021 | $10,077 | $105,696 | $11,306 | $94,390 |
| 2020 | $9,716 | $100,433 | $10,743 | $89,690 |
| 2019 | $9,440 | $92,053 | $10,255 | $81,798 |
| 2018 | $270 | $2,418 | $2,418 | $0 |
| 2017 | $266 | $2,276 | $2,276 | $0 |
| 2016 | $266 | $2,107 | $2,107 | $0 |
| 2013 | -- | $2,037 | $2,037 | $0 |
Source: Public Records
Map
Nearby Homes
- Lt 7 Flagg Ln
- Lt 8 Flagg Ln
- Lt 13 Flagg Ln
- Roosevelt II - Ranch Plan at Fairview Estates
- Adams III - Ranch Plan at Fairview Estates
- McMahon - Ranch Plan at Fairview Estates
- Marino - Ranch Plan at Fairview Estates
- Kennedy - Ranch Plan at Fairview Estates
- Lincoln - Ranch Plan at Fairview Estates
- Newport - Two-story Plan at Fairview Estates
- Monroe II - Two-story Plan at Fairview Estates
- Elway - Ranch Plan at Fairview Estates
- Roosevelt - Ranch Plan at Fairview Estates
- Adams II - Ranch Plan at Fairview Estates
- Dawson - Two-story Plan at Fairview Estates
- Madison - Two-story Plan at Fairview Estates
- Bradshaw - Two-story Plan at Fairview Estates
- Pasadena II - Ranch Plan at Fairview Estates
- Truman III - Two-story Plan at Fairview Estates
- Harrison - Ranch Plan at Fairview Estates