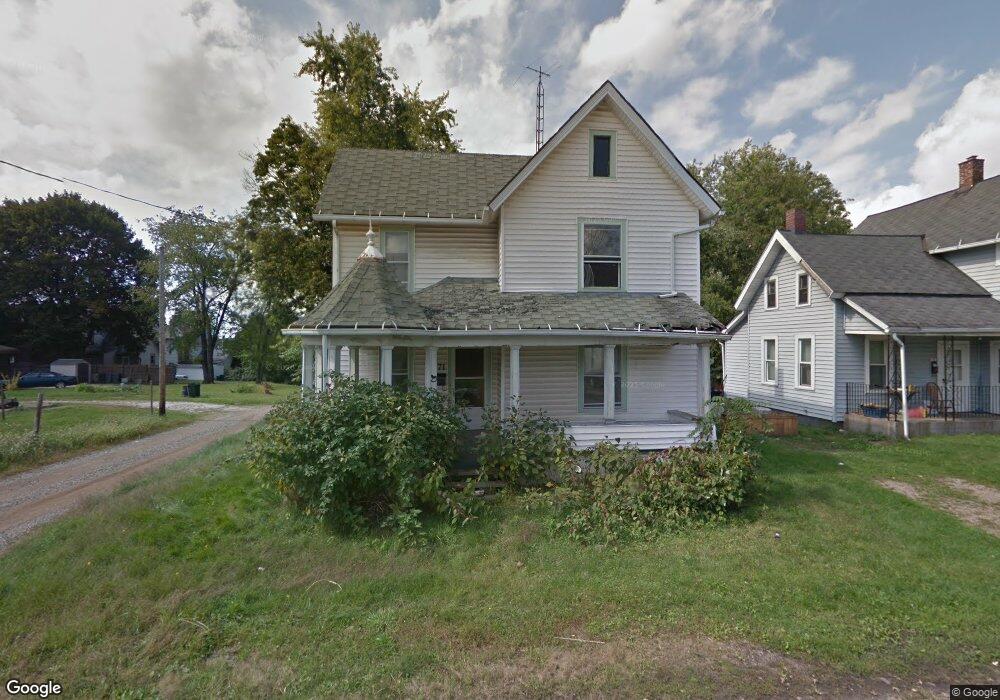
671 Fries St SE Massillon, OH 44646
Downtown Massillon NeighborhoodEstimated Value: $106,000 - $307,000
3
Beds
1
Bath
1,456
Sq Ft
$124/Sq Ft
Est. Value
About This Home
This home is located at 671 Fries St SE, Massillon, OH 44646 and is currently estimated at $180,333, approximately $123 per square foot. 671 Fries St SE is a home located in Stark County with nearby schools including Massillon Intermediate School, Massillon Junior High School, and Washington High School.
Ownership History
Date
Name
Owned For
Owner Type
Purchase Details
Closed on
Feb 19, 2020
Sold by
Ez Access Funding Llc
Bought by
Portgage Banc Llc
Current Estimated Value
Purchase Details
Closed on
Jan 7, 2009
Sold by
Deutsche Bank National Trust Company
Bought by
Ez Access Funding Llc
Purchase Details
Closed on
Dec 11, 2008
Sold by
Blood Kenneth
Bought by
Deutsche Bank National Trust Company
Purchase Details
Closed on
May 31, 2000
Sold by
May Sarah J
Bought by
Blood Kenneth
Home Financials for this Owner
Home Financials are based on the most recent Mortgage that was taken out on this home.
Original Mortgage
$45,900
Interest Rate
10.99%
Mortgage Type
Purchase Money Mortgage
Purchase Details
Closed on
Oct 7, 1994
Sold by
Hattery Dorothy M
Bought by
May David B
Create a Home Valuation Report for This Property
The Home Valuation Report is an in-depth analysis detailing your home's value as well as a comparison with similar homes in the area
Home Values in the Area
Average Home Value in this Area
Purchase History
| Date | Buyer | Sale Price | Title Company |
|---|---|---|---|
| Portgage Banc Llc | $6,500 | None Available | |
| Ez Access Funding Llc | $8,300 | Prism Title & Closing Servic | |
| Deutsche Bank National Trust Company | $32,301 | None Available | |
| Blood Kenneth | $44,000 | -- | |
| May David B | $20,500 | -- |
Source: Public Records
Mortgage History
| Date | Status | Borrower | Loan Amount |
|---|---|---|---|
| Previous Owner | Blood Kenneth | $45,900 |
Source: Public Records
Tax History Compared to Growth
Tax History
| Year | Tax Paid | Tax Assessment Tax Assessment Total Assessment is a certain percentage of the fair market value that is determined by local assessors to be the total taxable value of land and additions on the property. | Land | Improvement |
|---|---|---|---|---|
| 2025 | $18,364 | $3,470 | $3,470 | -- |
| 2024 | $17,255 | $3,470 | $3,470 | -- |
| 2023 | $16,806 | $9,740 | $5,570 | $4,170 |
| 2022 | $862 | $9,740 | $5,570 | $4,170 |
| 2021 | $1,055 | $9,740 | $5,570 | $4,170 |
| 2020 | $902 | $9,730 | $4,550 | $5,180 |
| 2019 | $1,623 | $9,730 | $4,550 | $5,180 |
| 2018 | $1,051 | $9,730 | $4,550 | $5,180 |
| 2017 | $12,914 | $9,140 | $4,620 | $4,520 |
| 2016 | $10,786 | $9,140 | $4,620 | $4,520 |
| 2015 | $1,473 | $9,140 | $4,620 | $4,520 |
| 2014 | $1,121 | $9,070 | $4,590 | $4,480 |
| 2013 | $962 | $9,070 | $4,590 | $4,480 |
Source: Public Records
Map
Nearby Homes
- 652 Young St SE
- 233 Edwin Ave SE
- 17 Maple Ave SE
- 804 Erie St S
- 202 Rose Ave SE
- 1319 Walnut Rd SE
- 824 Oak Ave SE
- 509 Tremont Ave SE
- 46 5th St SE
- 1225 Erie St S
- 832 Wellman Ave SE
- 637 Wallace Ave SE
- 1274 13th St SE
- 532 4th St SW
- 3476 Joyce Ave NW Unit 15
- 3414 Joyce Ave NW Unit 18
- Lot 42 Joyce Ave NW
- 1117 Cleveland St SW
- 521 Federal Ave NE
- 0 Pearl SE Unit 5155028
- 665 Fries St SE
- 816 Walnut Rd SE
- 820 Walnut Rd SE
- 804 Walnut Rd SE
- 655 Fries St SE
- 664 Fries St SE
- 830 Walnut Rd SE
- 660 Fries St SE
- 800 Walnut Rd SE
- 651 Fries St SE
- 316 Walnut Rd SE
- 840 Walnut Rd SE
- 807 Dielhenn Ave SE
- 809 Dielhenn Ave SE
- 817 Dielhenn Ave SE
- 805 Dielhenn Ave SE
- 801 Dielhenn Ave SE
- 819 Dielhenn Ave SE
- 310 Walnut Rd SE
- 641 Fries St SE