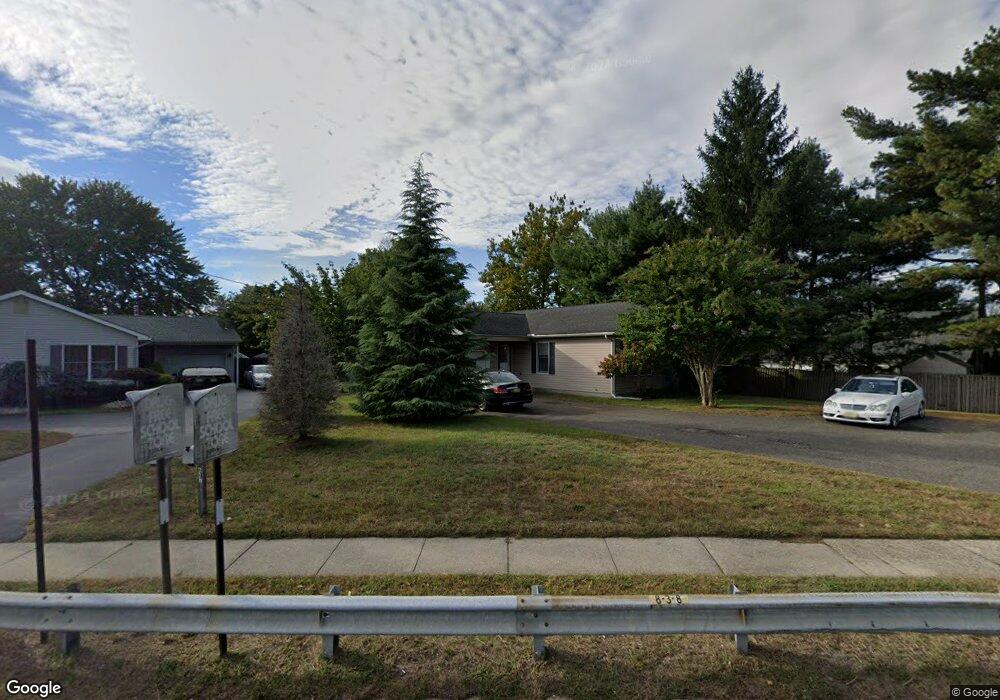
671 Lloyd Rd Matawan, NJ 07747
Estimated Value: $594,000 - $679,000
3
Beds
2
Baths
1,571
Sq Ft
$414/Sq Ft
Est. Value
About This Home
This home is located at 671 Lloyd Rd, Matawan, NJ 07747 and is currently estimated at $649,971, approximately $413 per square foot. 671 Lloyd Rd is a home located in Monmouth County with nearby schools including Matawan Reg High School, St. Joseph Elementary School, and Icob Academy.
Ownership History
Date
Name
Owned For
Owner Type
Purchase Details
Closed on
Jan 16, 2021
Sold by
Walsh Joseph
Bought by
Hansen Eric G and Hansen Pattyann
Current Estimated Value
Purchase Details
Closed on
Jun 6, 1996
Sold by
Oaks Bristol
Bought by
Walsh Joseph
Home Financials for this Owner
Home Financials are based on the most recent Mortgage that was taken out on this home.
Original Mortgage
$127,000
Interest Rate
7.97%
Create a Home Valuation Report for This Property
The Home Valuation Report is an in-depth analysis detailing your home's value as well as a comparison with similar homes in the area
Home Values in the Area
Average Home Value in this Area
Purchase History
| Date | Buyer | Sale Price | Title Company |
|---|---|---|---|
| Hansen Eric G | -- | None Available | |
| Walsh Joseph | $128,000 | -- |
Source: Public Records
Mortgage History
| Date | Status | Borrower | Loan Amount |
|---|---|---|---|
| Previous Owner | Walsh Joseph | $127,000 |
Source: Public Records
Tax History Compared to Growth
Tax History
| Year | Tax Paid | Tax Assessment Tax Assessment Total Assessment is a certain percentage of the fair market value that is determined by local assessors to be the total taxable value of land and additions on the property. | Land | Improvement |
|---|---|---|---|---|
| 2025 | $10,620 | $575,400 | $390,600 | $184,800 |
| 2024 | $10,207 | $525,500 | $329,000 | $196,500 |
Source: Public Records
Map
Nearby Homes
- 120 Andover Ln
- 15 Janine Place
- 39-41 Atlantic Ave
- 10 Johnson Ave
- 16 Galway Dr
- 557 Lloyd Rd Unit B
- 154 Lower Main St
- 101 Broad St
- 46 Parkview Dr
- 9 Tralee Rd
- 5 7th St
- 22 Lower Main St
- 5 Lower Main St
- 101 Cresci Blvd
- 537 S Atlantic Ave
- 47 Village Green Way
- 52 Highway 35
- 627 Beers St
- 253 Broadway
- 272 Main St