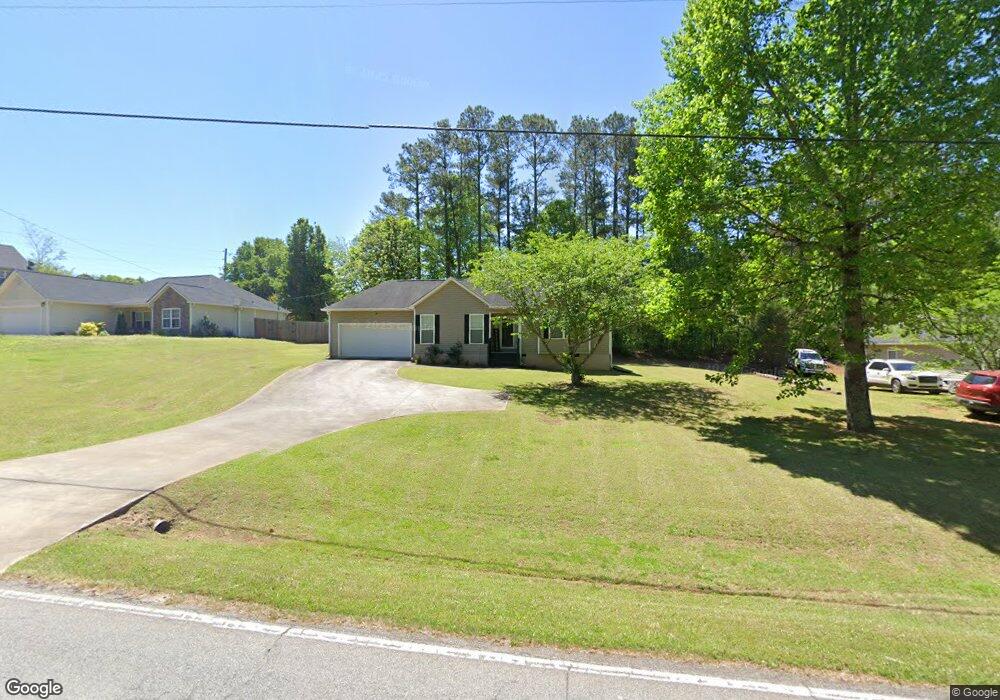
671 McKenzie Bridge Rd Carrollton, GA 30116
Abilene NeighborhoodEstimated Value: $247,000 - $264,000
3
Beds
2
Baths
1,334
Sq Ft
$192/Sq Ft
Est. Value
About This Home
This home is located at 671 McKenzie Bridge Rd, Carrollton, GA 30116 and is currently estimated at $256,142, approximately $192 per square foot. 671 McKenzie Bridge Rd is a home located in Carroll County with nearby schools including Sharp Creek Elementary School, Bay Springs Middle School, and Villa Rica High School.
Ownership History
Date
Name
Owned For
Owner Type
Purchase Details
Closed on
Sep 19, 2006
Sold by
Not Provided
Bought by
Lambert Genia B
Current Estimated Value
Purchase Details
Closed on
Jul 27, 2005
Sold by
Maxwell Billy F
Bought by
Lambert Genia B
Home Financials for this Owner
Home Financials are based on the most recent Mortgage that was taken out on this home.
Original Mortgage
$99,920
Interest Rate
5.48%
Mortgage Type
New Conventional
Purchase Details
Closed on
Feb 8, 2005
Sold by
Allums Steven E
Bought by
Maxwell Billy F
Purchase Details
Closed on
Dec 9, 2003
Sold by
Lost Lake Dev Co Llc
Bought by
Allums Steven E
Purchase Details
Closed on
Jul 18, 2003
Bought by
Lost Lake Dev Corp Llc
Create a Home Valuation Report for This Property
The Home Valuation Report is an in-depth analysis detailing your home's value as well as a comparison with similar homes in the area
Home Values in the Area
Average Home Value in this Area
Purchase History
| Date | Buyer | Sale Price | Title Company |
|---|---|---|---|
| Lambert Genia B | -- | -- | |
| Lambert Genia B | $124,900 | -- | |
| Maxwell Billy F | -- | -- | |
| Allums Steven E | $129,400 | -- | |
| Allums Steven E | -- | -- | |
| Lost Lake Dev Corp Llc | -- | -- |
Source: Public Records
Mortgage History
| Date | Status | Borrower | Loan Amount |
|---|---|---|---|
| Previous Owner | Lambert Genia B | $99,920 |
Source: Public Records
Tax History Compared to Growth
Tax History
| Year | Tax Paid | Tax Assessment Tax Assessment Total Assessment is a certain percentage of the fair market value that is determined by local assessors to be the total taxable value of land and additions on the property. | Land | Improvement |
|---|---|---|---|---|
| 2023 | $1,270 | $87,539 | $8,000 | $79,539 |
| 2022 | $1,501 | $71,817 | $8,000 | $63,817 |
| 2021 | $1,374 | $62,745 | $8,000 | $54,745 |
| 2020 | $1,258 | $56,248 | $8,000 | $48,248 |
| 2019 | $1,195 | $52,263 | $8,000 | $44,263 |
| 2018 | $1,155 | $49,166 | $10,000 | $39,166 |
| 2017 | $1,158 | $49,166 | $10,000 | $39,166 |
| 2016 | $1,159 | $49,166 | $10,000 | $39,166 |
| 2015 | $1,150 | $45,118 | $8,000 | $37,119 |
| 2014 | $1,155 | $45,119 | $8,000 | $37,119 |
Source: Public Records
Map
Nearby Homes
- 255 Emerald Pointe Dr
- 0 Shady Grove Rd Unit 10601173
- 0 Shady Grove Rd Unit 10601172
- 1890 Shady Grove Rd
- 0 Knight Dr W
- 201 Deerfield Ln
- 133 Deerfield Ln
- 0 Old Airport Rd Unit 10599783
- 0 Old Airport Rd Unit 7642336
- 0 Old Airport Rd Unit 10599779
- 10 Deerfield Ln
- 0 Frashier Rd Unit 7549781
- 0 Frashier Rd Unit 10488685
- 1196 N Highway 113
- The McGinnis Plan at Morgan Landing
- 221 Turtle Cove
- 131 Hunter Way
- 255 Morgan Rd
- 2580 Shady Grove Rd
- 183 Muse Bridge Rd
- 681 McKenzie Bridge Rd
- 661 McKenzie Bridge Rd
- 2312 Shady Grove Rd
- 2332 Shady Grove Rd
- 100 McKenzie Overlook Dr
- 116 McKenzie Overlook Dr
- 2300 Shady Grove Rd
- 104 McKenzie Overlook Dr
- 0 McKenzie Overlook Dr Unit 8387322
- 0 McKenzie Overlook Dr Unit 8173608
- 2290 Shady Grove Rd
- 120 McKenzie Overlook Dr
- 2309 Shady Grove Rd Unit B
- 2309 Shady Grove Rd
- 2325 Shady Grove Rd Unit B
- 2325 Shady Grove Rd Unit A
- 2325 Shady Grove Rd
- 2325 Shady Grove Rd Unit B
- 2325 Shady Grove Rd Unit A
- 2325 Shady Grove Rd Unit 3