Estimated Value: $250,000 - $298,000
3
Beds
2
Baths
1,752
Sq Ft
$152/Sq Ft
Est. Value
About This Home
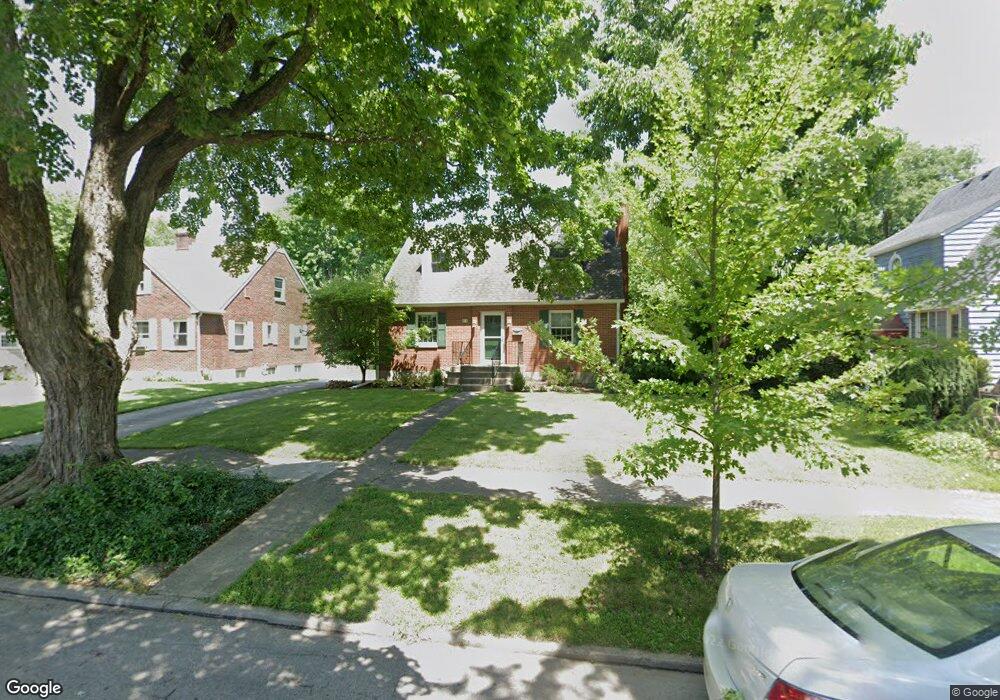
This home is located at 671 N Galloway St, Xenia, OH 45385 and is currently estimated at $265,796, approximately $151 per square foot. 671 N Galloway St is a home located in Greene County with nearby schools including Xenia High School, Summit Academy Community School for Alternative Learners - Xenia, and Legacy Christian Academy.
Ownership History
Date
Name
Owned For
Owner Type
Purchase Details
Closed on
Feb 21, 2014
Sold by
Simstad Stephanie A and Hines Jeffrey G
Bought by
Hines Stephanie A and Hines Jeffrey G
Current Estimated Value
Purchase Details
Closed on
Jul 28, 2000
Sold by
Whitted Daniel T and Whitted Moro L
Bought by
Simstad Stephanie A
Home Financials for this Owner
Home Financials are based on the most recent Mortgage that was taken out on this home.
Original Mortgage
$109,150
Interest Rate
7.9%
Purchase Details
Closed on
Mar 7, 1996
Sold by
Holley Kipra B
Bought by
Whitted Daniel T and Whitted Moro L
Home Financials for this Owner
Home Financials are based on the most recent Mortgage that was taken out on this home.
Original Mortgage
$87,935
Interest Rate
7.05%
Mortgage Type
FHA
Create a Home Valuation Report for This Property
The Home Valuation Report is an in-depth analysis detailing your home's value as well as a comparison with similar homes in the area
Home Values in the Area
Average Home Value in this Area
Purchase History
| Date | Buyer | Sale Price | Title Company |
|---|---|---|---|
| Hines Stephanie A | -- | None Available | |
| Simstad Stephanie A | $114,900 | -- | |
| Whitted Daniel T | $88,000 | -- |
Source: Public Records
Mortgage History
| Date | Status | Borrower | Loan Amount |
|---|---|---|---|
| Previous Owner | Simstad Stephanie A | $109,150 | |
| Previous Owner | Whitted Daniel T | $87,935 |
Source: Public Records
Tax History Compared to Growth
Tax History
| Year | Tax Paid | Tax Assessment Tax Assessment Total Assessment is a certain percentage of the fair market value that is determined by local assessors to be the total taxable value of land and additions on the property. | Land | Improvement |
|---|---|---|---|---|
| 2024 | $2,638 | $61,660 | $10,870 | $50,790 |
| 2023 | $2,638 | $61,660 | $10,870 | $50,790 |
| 2022 | $2,240 | $44,650 | $6,790 | $37,860 |
| 2021 | $2,270 | $44,650 | $6,790 | $37,860 |
| 2020 | $2,175 | $44,650 | $6,790 | $37,860 |
| 2019 | $2,109 | $40,760 | $7,250 | $33,510 |
| 2018 | $2,117 | $40,760 | $7,250 | $33,510 |
| 2017 | $2,074 | $40,760 | $7,250 | $33,510 |
| 2016 | $2,075 | $39,190 | $7,250 | $31,940 |
| 2015 | $2,080 | $39,190 | $7,250 | $31,940 |
| 2014 | $1,937 | $39,190 | $7,250 | $31,940 |
Source: Public Records
Map
Nearby Homes
- 613 N West St
- 659 N King St
- 516 N King St
- 878 N Detroit St
- 902 N Detroit St
- 137 Pleasant St
- 1038 Frederick Dr
- 1171 N Detroit St
- 119 Park Dr
- 509 Antrim Rd
- 0 W Church St
- 214 Corwin Ave
- 883 Omard Dr
- 912 Omard Dr
- 348 S Stadium Dr
- 479 N Stadium Dr
- 508 Marshall Dr
- 513 Redbud Ln
- 568 Louise Dr
- 610 Saxony Dr
- 683 N Galloway St
- 659 N Galloway St
- 693 N Galloway St
- 641 N Galloway St
- 652 N King St
- 678 N King St
- 629 N Galloway St
- 713 N Galloway St
- 694 N King St
- 640 N King St
- 674 N Galloway St
- 688 N Galloway St
- 721 N Galloway St
- 619 N Galloway St
- 636 N Galloway St
- 702 N Galloway St
- 712 N King St
- 626 N King St
- 731 N Galloway St
- 611 N Galloway St