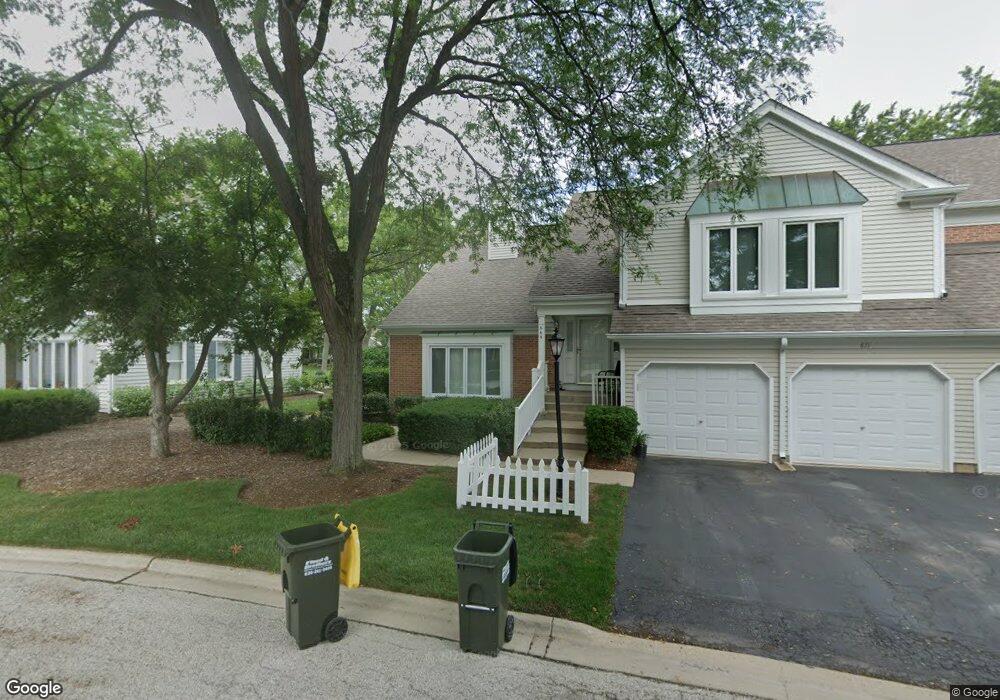
671 Regent Ln Unit A Prospect Heights, IL 60070
Estimated Value: $344,000 - $390,000
3
Beds
2
Baths
1,433
Sq Ft
$260/Sq Ft
Est. Value
About This Home
This home is located at 671 Regent Ln Unit A, Prospect Heights, IL 60070 and is currently estimated at $371,952, approximately $259 per square foot. 671 Regent Ln Unit A is a home located in Cook County with nearby schools including Euclid Elementary School, River Trails Middle School, and John Hersey High School.
Ownership History
Date
Name
Owned For
Owner Type
Purchase Details
Closed on
Mar 12, 2020
Sold by
Anderson Diane
Bought by
Anderson Diane and Diane Anderson Trust
Current Estimated Value
Purchase Details
Closed on
Oct 17, 2018
Sold by
Nesbit Robert P and Nesbit Robet P
Bought by
Anderson Diane
Home Financials for this Owner
Home Financials are based on the most recent Mortgage that was taken out on this home.
Original Mortgage
$192,000
Outstanding Balance
$168,144
Interest Rate
4.7%
Mortgage Type
New Conventional
Estimated Equity
$203,808
Purchase Details
Closed on
Jun 12, 2012
Sold by
Nesbit Robert P
Bought by
Nesbit Robert P and Robert P Nesbit Trust
Purchase Details
Closed on
May 3, 2011
Sold by
Bauer Charles L
Bought by
Nesbit Robert P
Purchase Details
Closed on
Dec 9, 1997
Sold by
Strandberg Bauer Charles L and Strandberg Bauer Judith C
Bought by
Bauer Charles L and Bauer Judith C
Create a Home Valuation Report for This Property
The Home Valuation Report is an in-depth analysis detailing your home's value as well as a comparison with similar homes in the area
Home Values in the Area
Average Home Value in this Area
Purchase History
| Date | Buyer | Sale Price | Title Company |
|---|---|---|---|
| Anderson Diane | -- | None Available | |
| Anderson Diane | $240,000 | Chicago Title | |
| Nesbit Robert P | -- | None Available | |
| Nesbit Robert P | $190,000 | Cti | |
| Bauer Charles L | -- | -- |
Source: Public Records
Mortgage History
| Date | Status | Borrower | Loan Amount |
|---|---|---|---|
| Open | Anderson Diane | $192,000 |
Source: Public Records
Tax History Compared to Growth
Tax History
| Year | Tax Paid | Tax Assessment Tax Assessment Total Assessment is a certain percentage of the fair market value that is determined by local assessors to be the total taxable value of land and additions on the property. | Land | Improvement |
|---|---|---|---|---|
| 2024 | $5,570 | $23,423 | $2,109 | $21,314 |
| 2023 | $5,170 | $23,423 | $2,109 | $21,314 |
| 2022 | $5,170 | $23,423 | $2,109 | $21,314 |
| 2021 | $4,622 | $19,384 | $659 | $18,725 |
| 2020 | $4,575 | $19,384 | $659 | $18,725 |
| 2019 | $4,622 | $21,715 | $659 | $21,056 |
| 2018 | $5,962 | $18,157 | $527 | $17,630 |
| 2017 | $5,881 | $18,157 | $527 | $17,630 |
| 2016 | $5,487 | $18,157 | $527 | $17,630 |
| 2015 | $5,200 | $15,828 | $1,054 | $14,774 |
| 2014 | $5,142 | $15,828 | $1,054 | $14,774 |
| 2013 | $5,020 | $15,828 | $1,054 | $14,774 |
Source: Public Records
Map
Nearby Homes
- 212 Country Club Dr Unit 198
- 688 Glasgow Ln Unit 121133
- 763 Sussex Corner Ln Unit 15
- 603 Thistle Ln Unit 16185
- 501 Aberdeen Ln Unit C
- 354 Country Club Dr
- 1214 N Crabtree Ln
- 302 Lonsdale Rd
- 1121 N Greenfield Ln
- 1116 N Westgate Rd
- 203 Coldren Dr
- 206 E Camp Mcdonald Rd
- 703 Newcastle Ln
- 1000 N Westgate Rd
- 1142 N Boxwood Dr Unit B
- 1008 N Newberry Ln
- 1120 N Boxwood Dr Unit B
- 1205 E Camp Mcdonald Rd
- 300 E Marion Ave
- 1622 E Greenwood Dr
- 671 Regent Ln Unit 11384
- 669 Regent Ln Unit 11384
- 667 Regent Ln Unit 11384
- 673 Regent Ln Unit 11383
- 673 Regent Ln Unit C
- 665 Regent Ln Unit 11384
- 675 Regent Ln Unit D
- 663 Regent Ln Unit 11384
- 663 Regent Ln Unit F
- 677 Regent Ln Unit 11383
- 661 Regent Ln Unit 11384
- 679 Regent Ln Unit 11383
- 681 Regent Ln Unit 11383
- 676 Regent Ln Unit 11586
- 678 Regent Ln Unit 11586
- 683 Regent Ln Unit 11383
- 683 Regent Ln Unit A
- 662 Regent Ln Unit 11785L
- 662 Regent Ln Unit 11785
- 662 Regent Ln Unit 11785L