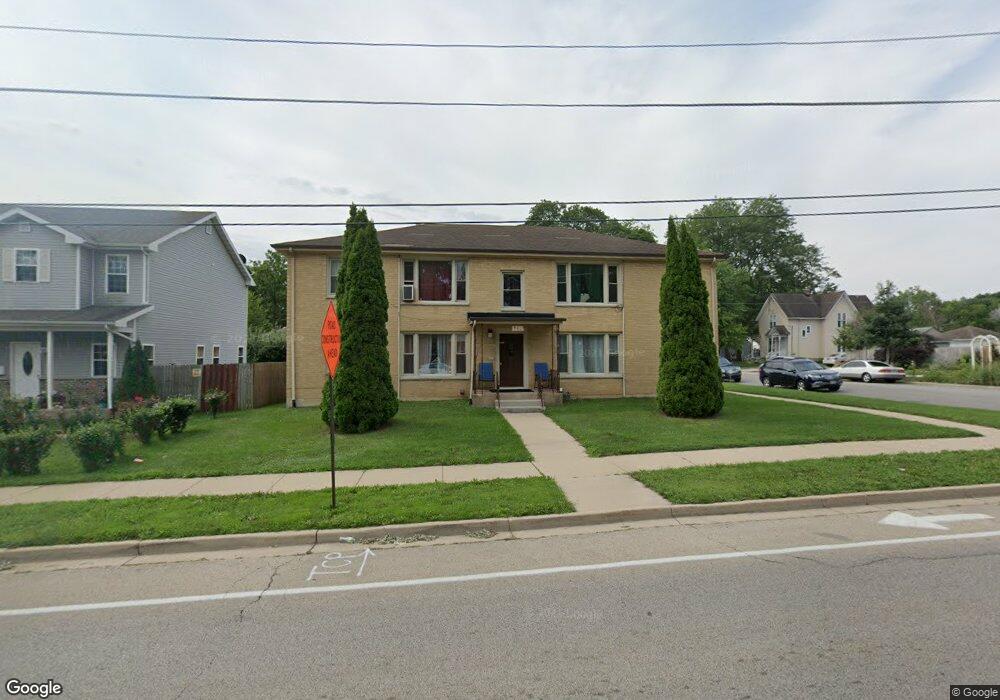
671 Walnut Ave Unit 73 Elgin, IL 60123
Southwest Elgin NeighborhoodEstimated Value: $412,000 - $502,027
Studio
--
Bath
3,392
Sq Ft
$137/Sq Ft
Est. Value
About This Home
This home is located at 671 Walnut Ave Unit 73, Elgin, IL 60123 and is currently estimated at $466,257, approximately $137 per square foot. 671 Walnut Ave Unit 73 is a home located in Kane County with nearby schools including Lowrie Elementary School, Abbott Middle School, and Larkin High School.
Ownership History
Date
Name
Owned For
Owner Type
Purchase Details
Closed on
Aug 2, 2004
Sold by
First Suburban National Bank
Bought by
Bayer Shawnette E and Dotson Joseph D
Current Estimated Value
Purchase Details
Closed on
Dec 17, 1999
Sold by
Lopez William G and Lopez Maria R
Bought by
Valle Braulio and Valle Gloria
Home Financials for this Owner
Home Financials are based on the most recent Mortgage that was taken out on this home.
Original Mortgage
$211,657
Interest Rate
7.69%
Mortgage Type
FHA
Purchase Details
Closed on
Jul 15, 1997
Sold by
Gross Frank L
Bought by
Lopez William G and Lopez Maria R
Home Financials for this Owner
Home Financials are based on the most recent Mortgage that was taken out on this home.
Original Mortgage
$184,050
Interest Rate
7.81%
Mortgage Type
FHA
Create a Home Valuation Report for This Property
The Home Valuation Report is an in-depth analysis detailing your home's value as well as a comparison with similar homes in the area
Home Values in the Area
Average Home Value in this Area
Purchase History
| Date | Buyer | Sale Price | Title Company |
|---|---|---|---|
| Bayer Shawnette E | -- | -- | |
| Valle Braulio | $230,000 | -- | |
| Lopez William G | $126,666 | -- |
Source: Public Records
Mortgage History
| Date | Status | Borrower | Loan Amount |
|---|---|---|---|
| Previous Owner | Valle Braulio | $211,657 | |
| Previous Owner | Lopez William G | $184,050 |
Source: Public Records
Tax History
| Year | Tax Paid | Tax Assessment Tax Assessment Total Assessment is a certain percentage of the fair market value that is determined by local assessors to be the total taxable value of land and additions on the property. | Land | Improvement |
|---|---|---|---|---|
| 2024 | $11,998 | $149,924 | $23,563 | $126,361 |
| 2023 | $11,546 | $135,445 | $21,287 | $114,158 |
| 2022 | $9,888 | $114,039 | $19,410 | $94,629 |
| 2021 | $9,512 | $106,618 | $18,147 | $88,471 |
| 2020 | $9,283 | $101,783 | $17,324 | $84,459 |
| 2019 | $9,055 | $96,954 | $16,502 | $80,452 |
| 2018 | $9,030 | $91,337 | $15,546 | $75,791 |
| 2017 | $9,448 | $91,858 | $15,635 | $76,223 |
| 2016 | $9,927 | $93,076 | $14,505 | $78,571 |
| 2015 | -- | $85,312 | $13,295 | $72,017 |
| 2014 | -- | $84,259 | $13,131 | $71,128 |
| 2013 | -- | $86,481 | $13,477 | $73,004 |
Source: Public Records
Map
Nearby Homes
- 315 Vandalia St
- 756 Walnut Ave
- 353 Wilcox Ave
- 761 South St
- 552 Walnut Ave
- 835 Oak St
- 800 Morgan St
- 208 Moseley St
- 455 Walnut Ave
- 118 Wilcox Ave
- 50 Sheridan St
- 331 Orange St
- 96 S Crystal St
- 78 S Edison Ave
- 490 S Alfred Ave
- 161 S Aldine Ave
- 9 N Jackson St
- 705 W Highland Ave
- 44 Monroe St
- 7 National St Unit 7
Your Personal Tour Guide
Ask me questions while you tour the home.