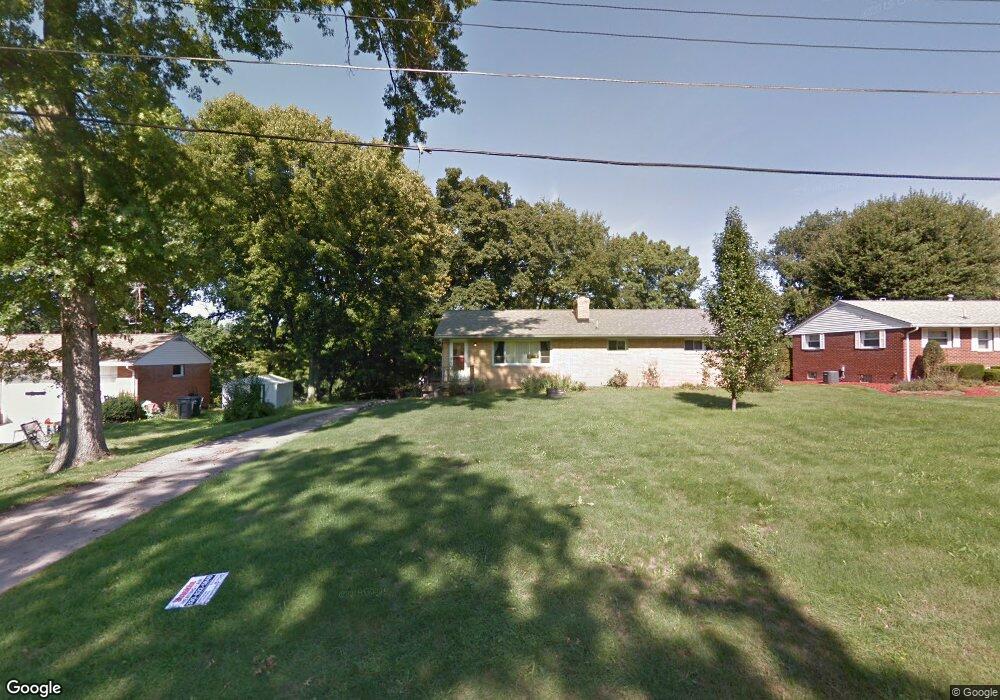
6710 Hlls Dls Rd NW Unit 12 Canton, OH 44708
Estimated Value: $114,209 - $140,000
2
Beds
1
Bath
816
Sq Ft
$156/Sq Ft
Est. Value
About This Home
This home is located at 6710 Hlls Dls Rd NW Unit 12, Canton, OH 44708 and is currently estimated at $127,552, approximately $156 per square foot. 6710 Hlls Dls Rd NW Unit 12 is a home located in Stark County with nearby schools including Amherst Elementary School, Jackson Memorial Middle School, and Jackson High School.
Ownership History
Date
Name
Owned For
Owner Type
Purchase Details
Closed on
Nov 21, 2019
Sold by
Mccoy Brian D
Bought by
Eisenbrei Gregory B
Current Estimated Value
Home Financials for this Owner
Home Financials are based on the most recent Mortgage that was taken out on this home.
Original Mortgage
$45,000
Outstanding Balance
$39,509
Interest Rate
3.5%
Mortgage Type
New Conventional
Estimated Equity
$88,043
Purchase Details
Closed on
May 29, 2014
Sold by
Douglas Michael L
Bought by
Mccoy Brian D
Purchase Details
Closed on
May 17, 2005
Sold by
Woods Gail A
Bought by
Douglas Michael L
Home Financials for this Owner
Home Financials are based on the most recent Mortgage that was taken out on this home.
Original Mortgage
$88,900
Interest Rate
6.05%
Mortgage Type
Fannie Mae Freddie Mac
Purchase Details
Closed on
Jul 29, 1992
Create a Home Valuation Report for This Property
The Home Valuation Report is an in-depth analysis detailing your home's value as well as a comparison with similar homes in the area
Home Values in the Area
Average Home Value in this Area
Purchase History
| Date | Buyer | Sale Price | Title Company |
|---|---|---|---|
| Eisenbrei Gregory B | $80,000 | None Available | |
| Mccoy Brian D | $76,000 | None Available | |
| Douglas Michael L | $88,900 | -- | |
| -- | -- | -- |
Source: Public Records
Mortgage History
| Date | Status | Borrower | Loan Amount |
|---|---|---|---|
| Open | Eisenbrei Gregory B | $45,000 | |
| Previous Owner | Douglas Michael L | $88,900 |
Source: Public Records
Tax History Compared to Growth
Tax History
| Year | Tax Paid | Tax Assessment Tax Assessment Total Assessment is a certain percentage of the fair market value that is determined by local assessors to be the total taxable value of land and additions on the property. | Land | Improvement |
|---|---|---|---|---|
| 2025 | -- | $31,400 | $8,230 | $23,170 |
| 2024 | -- | $31,400 | $8,230 | $23,170 |
| 2023 | $1,186 | $32,970 | $6,580 | $26,390 |
| 2022 | $602 | $32,970 | $6,580 | $26,390 |
| 2021 | $1,209 | $32,970 | $6,580 | $26,390 |
| 2020 | $1,154 | $30,110 | $5,850 | $24,260 |
| 2019 | $1,572 | $30,110 | $5,850 | $24,260 |
| 2018 | $1,586 | $30,110 | $5,850 | $24,260 |
| 2017 | $1,434 | $25,980 | $5,850 | $20,130 |
| 2016 | $1,660 | $25,980 | $5,850 | $20,130 |
| 2015 | $1,534 | $25,980 | $5,850 | $20,130 |
| 2014 | $1,366 | $23,220 | $6,060 | $17,160 |
| 2013 | $674 | $23,220 | $6,060 | $17,160 |
Source: Public Records
Map
Nearby Homes
- 3490 Cardiff Ave NW
- 3591 Harris Ave NW
- 3432 Stillwater Ave NW
- 6487 - 6523 Hills And Dales Rd NW
- 3633 Barrington Place NW
- 3051 Blue Ash Ave NW
- 2172 Via Luna Cir NE Unit 16
- 2174 Via Luna Cir NE Unit 15
- 3452 Joyce Ave NW
- 3451 Joyce Ave NW
- 3477 Joyce Ave NW
- 3501 Joyce Ave NW
- Lot 33 Joyce Ave NW
- 3430 Joyce Ave NW
- 3485 Joyce Ave NW
- 3533 Joyce Ave NW
- 3517 Joyce Ave NW
- 3545 Joyce Ave NW
- 3579 Joyce Ave NW
- Lot 38 Joyce Ave NW
- 6708 Hlls Dls Rd NW Unit 11
- 6726 Hlls Dls Rd NW Unit 15
- 6722 Hills And Dales Rd NW
- 6710 Hills And Dales Rd NW
- 6708 Hills And Dales Rd NW
- 6726 Hills And Dales Rd NW
- 6728 Hills And Dales Rd NW
- 6724 Hlls Dls Rd NW Unit 14
- 6724 Hills And Dales Rd NW
- 6704 Hills And Dales Rd NW Unit 9
- 6706 Hlls Dls Rd NW Unit 10
- 6744 Hills And Dales Rd NW
- 6688 Hills And Dales Rd NW
- 6686 Hills And Dales Rd NW Unit 6
- 6690 Hills And Dales Rd NW
- 6684 Hills And Dales Rd NW
- 3578 White Tail Ave NW
- 6677 Groton St NW
- 6695 Groton St NW
- 6720 Thicket St NW