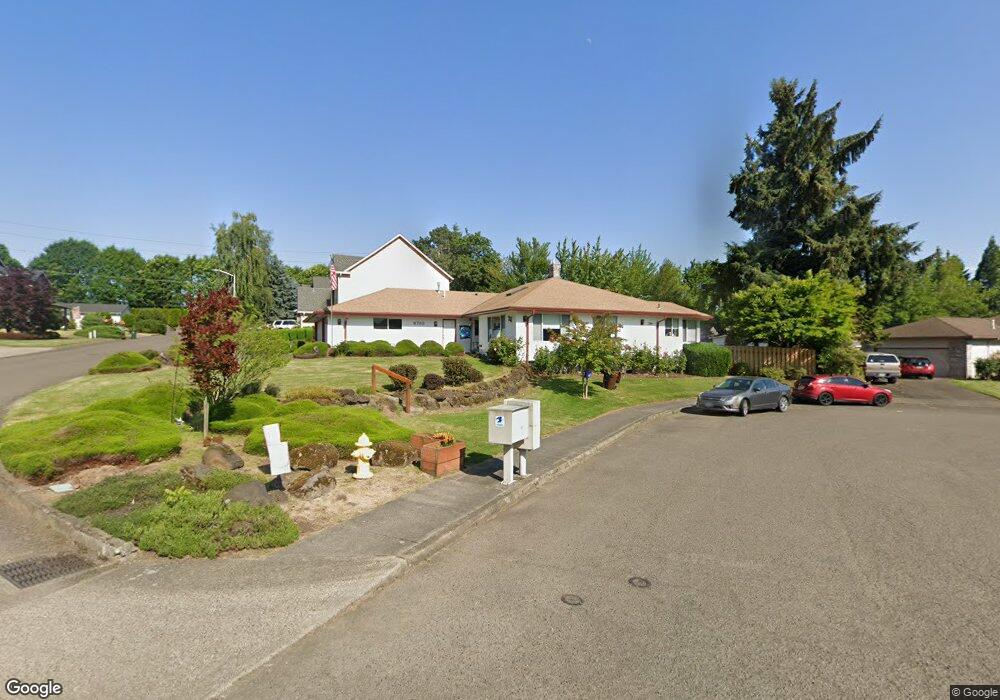
6710 SE Blatner Relisted Milwaukie, OR 97267
North Clackamas NeighborhoodEstimated Value: $583,000 - $670,000
3
Beds
2
Baths
2,143
Sq Ft
$295/Sq Ft
Est. Value
About This Home
This home is located at 6710 SE Blatner Relisted, Milwaukie, OR 97267 and is currently estimated at $633,018, approximately $295 per square foot. 6710 SE Blatner Relisted is a home located in Clackamas County with nearby schools including View Acres Elementary School, Alder Creek Middle School, and Rex Putnam High School.
Ownership History
Date
Name
Owned For
Owner Type
Purchase Details
Closed on
Jul 24, 2015
Sold by
Keough Patrick Joseph
Bought by
Luckett Donna R and Galloway Barbara J
Current Estimated Value
Home Financials for this Owner
Home Financials are based on the most recent Mortgage that was taken out on this home.
Original Mortgage
$213,000
Outstanding Balance
$166,490
Interest Rate
4.01%
Mortgage Type
New Conventional
Estimated Equity
$466,528
Purchase Details
Closed on
Mar 7, 2008
Sold by
Keough Patrick and Keough Patricia
Bought by
Keough Patrick Joseph and Keough Patricia Ann
Purchase Details
Closed on
Jun 22, 2001
Sold by
Rogers Harold Gene
Bought by
Keough Patrick and Keough Patricia
Home Financials for this Owner
Home Financials are based on the most recent Mortgage that was taken out on this home.
Original Mortgage
$150,000
Interest Rate
7.15%
Purchase Details
Closed on
Jun 14, 1996
Sold by
Crosswhite Patricia Irene and Rogers Patricia Irene
Bought by
Rogers Harold Gene
Create a Home Valuation Report for This Property
The Home Valuation Report is an in-depth analysis detailing your home's value as well as a comparison with similar homes in the area
Home Values in the Area
Average Home Value in this Area
Purchase History
| Date | Buyer | Sale Price | Title Company |
|---|---|---|---|
| Luckett Donna R | $340,000 | First American | |
| Keough Patrick Joseph | -- | None Available | |
| Keough Patrick | $226,000 | Pacific Nw Title | |
| Rogers Harold Gene | -- | -- |
Source: Public Records
Mortgage History
| Date | Status | Borrower | Loan Amount |
|---|---|---|---|
| Open | Luckett Donna R | $213,000 | |
| Previous Owner | Keough Patrick | $150,000 |
Source: Public Records
Tax History Compared to Growth
Tax History
| Year | Tax Paid | Tax Assessment Tax Assessment Total Assessment is a certain percentage of the fair market value that is determined by local assessors to be the total taxable value of land and additions on the property. | Land | Improvement |
|---|---|---|---|---|
| 2025 | $7,420 | $390,116 | -- | -- |
| 2024 | $7,158 | $378,754 | -- | -- |
| 2023 | $7,158 | $367,723 | $0 | $0 |
| 2022 | $6,583 | $357,013 | $0 | $0 |
| 2021 | $6,343 | $346,615 | $0 | $0 |
| 2020 | $6,014 | $336,520 | $0 | $0 |
| 2019 | $5,883 | $326,719 | $0 | $0 |
| 2018 | $5,301 | $317,203 | $0 | $0 |
| 2017 | $5,132 | $307,964 | $0 | $0 |
| 2016 | $4,950 | $298,994 | $0 | $0 |
| 2015 | $4,746 | $290,285 | $0 | $0 |
| 2014 | $4,401 | $281,830 | $0 | $0 |
Source: Public Records
Map
Nearby Homes
- 6514 SE Thiessen Rd
- 14822 SE Brightwood Ave
- 14641 SE Thornapple Ln
- 14617 SE Thornapple Ln
- 7294 SE Thiessen Rd
- 14730 SE Luella Ln
- 6973 SE Savanna St
- 7338 SE Thiessen Rd
- 0 SE Minerva Rd
- 6313 SE Chloe Rose Way
- 14633 SE Carol Ave
- 6320 SE Roethe Rd
- 15081 SE Mount Royale Ct
- 7802 SE Sporri Ln Unit 21
- 7874 SE Sporri Ln Unit 15
- 15263 SE Duckey Ln
- 7825 SE Sporri Ln
- 6725 SE Mabel Ave
- 7990 SE Brentwood Ct
- 8025 SE Sporri Ln
- 6710 SE Blatner 27deep 3car
- 6710 SE Blatner Place
- 6732 SE Blatner Place
- 6686 SE Montego Bay St
- 6677 SE Thiessen Rd
- 6622 SE Montego Bay St
- 6715 SE Blatner Place
- 6754 SE Blatner Place
- 6668 SE Montego Bay St
- 6737 SE Blatner Place
- 6627 SE Montego Bay St
- 6644 SE Montego Bay St
- 6757 SE Blatner Place
- 6600 SE Montego Bay St
- 6780 SE Blatner Place
- 6605 SE Montego Bay St
- 6680 SE Tuscany Ct
- 6640 SE Tuscany Ct
- 6730 SE Tuscany Ct
- 6781 SE Blatner Place