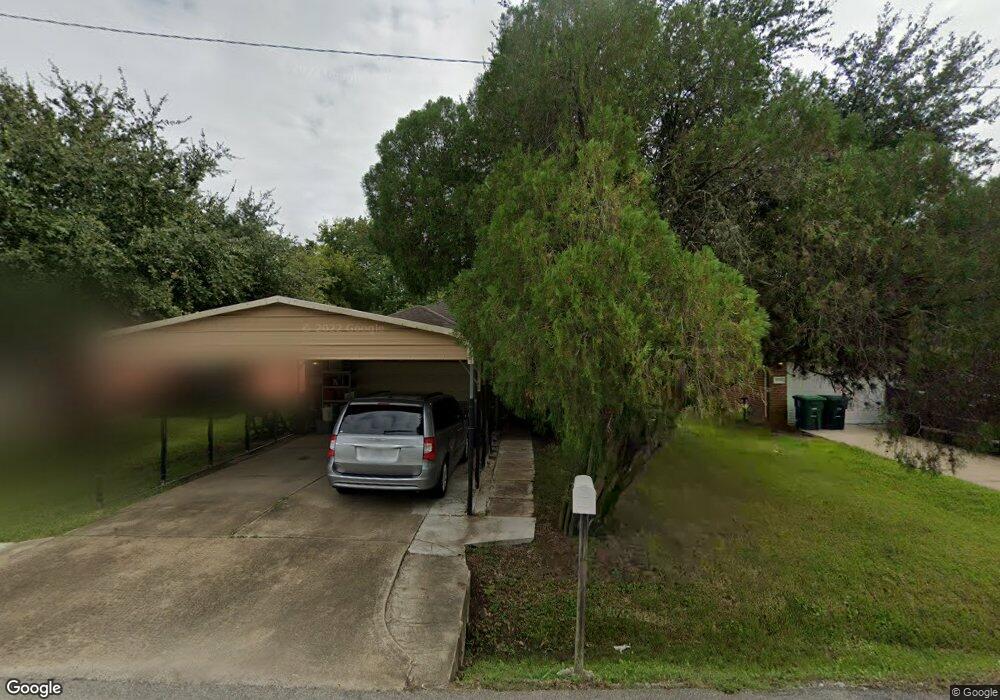
6711 Lozier St Houston, TX 77021
OST-South Union NeighborhoodEstimated Value: $228,000 - $318,000
3
Beds
2
Baths
1,227
Sq Ft
$213/Sq Ft
Est. Value
About This Home
This home is located at 6711 Lozier St, Houston, TX 77021 and is currently estimated at $261,141, approximately $212 per square foot. 6711 Lozier St is a home located in Harris County with nearby schools including Thompson Elementary School, Cullen Middle School, and Yates High School.
Ownership History
Date
Name
Owned For
Owner Type
Purchase Details
Closed on
Jun 1, 2011
Sold by
The Secretary Of Housing & Urban Develop
Bought by
Nettles Henry
Current Estimated Value
Purchase Details
Closed on
Aug 23, 2010
Sold by
Midfirst Bank
Bought by
The Secretary Of Housing & Urban Develop
Purchase Details
Closed on
Aug 3, 2010
Sold by
Davis Wanda
Bought by
Midfirst Bank
Purchase Details
Closed on
Mar 18, 2005
Sold by
Lazer Homes Inc
Bought by
Davis Wanda
Home Financials for this Owner
Home Financials are based on the most recent Mortgage that was taken out on this home.
Original Mortgage
$101,408
Interest Rate
5.67%
Mortgage Type
FHA
Purchase Details
Closed on
Oct 7, 2004
Sold by
Garvin Lawrence E and Spivey John P
Bought by
Lazer Homes Inc
Create a Home Valuation Report for This Property
The Home Valuation Report is an in-depth analysis detailing your home's value as well as a comparison with similar homes in the area
Home Values in the Area
Average Home Value in this Area
Purchase History
| Date | Buyer | Sale Price | Title Company |
|---|---|---|---|
| Nettles Henry | -- | None Available | |
| Nettles Henry | -- | None Available | |
| The Secretary Of Housing & Urban Develop | -- | None Available | |
| Midfirst Bank | $122,316 | None Available | |
| Davis Wanda | -- | Stewart Title Company | |
| Lazer Homes Inc | -- | Stewart Title Houston Div |
Source: Public Records
Mortgage History
| Date | Status | Borrower | Loan Amount |
|---|---|---|---|
| Previous Owner | Davis Wanda | $101,408 |
Source: Public Records
Tax History Compared to Growth
Tax History
| Year | Tax Paid | Tax Assessment Tax Assessment Total Assessment is a certain percentage of the fair market value that is determined by local assessors to be the total taxable value of land and additions on the property. | Land | Improvement |
|---|---|---|---|---|
| 2025 | $34 | $251,775 | $121,800 | $129,975 |
| 2024 | $34 | $252,430 | $111,650 | $140,780 |
| 2023 | $34 | $256,491 | $106,575 | $149,916 |
| 2022 | $3,734 | $220,622 | $91,350 | $129,272 |
| 2021 | $3,593 | $170,284 | $55,825 | $114,459 |
| 2020 | $3,394 | $162,700 | $34,256 | $128,444 |
| 2019 | $3,224 | $146,072 | $26,644 | $119,428 |
| 2018 | $463 | $115,835 | $22,838 | $92,997 |
| 2017 | $2,725 | $115,835 | $22,838 | $92,997 |
| 2016 | $2,478 | $97,982 | $15,675 | $82,307 |
| 2015 | $2,519 | $97,982 | $15,675 | $82,307 |
| 2014 | $2,519 | $97,982 | $15,675 | $82,307 |
Source: Public Records
Map
Nearby Homes
- 6734 Lozier St
- 6732 Lozier St
- 6725 Burkett St
- 6723 Burkett St
- 7001 Burkett St
- 6815 Cadillac St
- 0 Cadillac St
- 6658 Stearns St
- 6814 Burkett St Unit B
- 6827 Burkett St
- 6723 Del Rio St
- 6653 Lozier St
- 6703 Del Rio St
- 6714 Winton St
- 6712 Winton St
- 6810 Del Rio St Unit 4
- 6644 Burkett St
- 6920 Winton St
- 6840 Del Rio St
- 6814 Del Rio St
- 6709 Lozier St
- 6715 Lozier St
- 6729 Lozier St
- 6714 Stearns St
- 6728 Stearns St
- 6731 Lozier St
- 6720 Lozier St
- 6718 Lozier St
- 6714 Lozier St
- 6722 Lozier St
- 6730 Stearns St
- 6710 Lozier St
- 6701 Lozier St
- 6708 Lozier St
- 6734 Stearns St
- 6706 Lozier St
- 6737 Lozier St
- 6702 Lozier St
- 6736 Lozier St
- 6711 Burkett St