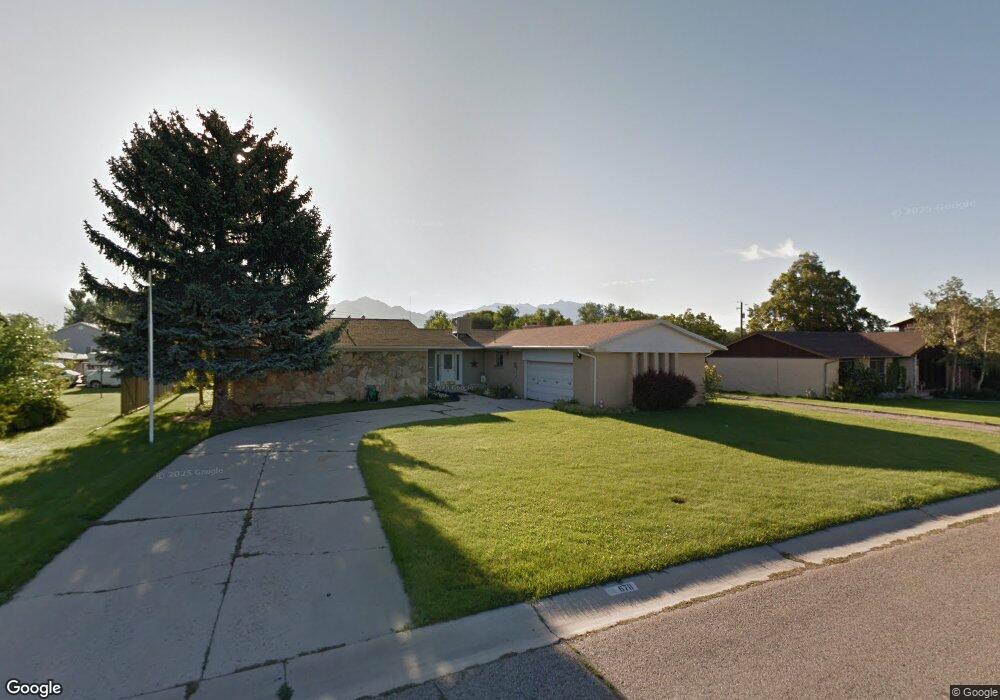
6711 S 2795 W West Jordan, UT 84084
Estimated Value: $750,000 - $807,830
4
Beds
3
Baths
2,228
Sq Ft
$349/Sq Ft
Est. Value
About This Home
This home is located at 6711 S 2795 W, West Jordan, UT 84084 and is currently estimated at $776,708, approximately $348 per square foot. 6711 S 2795 W is a home located in Salt Lake County with nearby schools including West Jordan Middle School, West Jordan High School, and Learning Tree School - Southwest.
Ownership History
Date
Name
Owned For
Owner Type
Purchase Details
Closed on
Dec 3, 2020
Sold by
Hunsaker Sherry Lee and Lu Wana Naegle Paxman Family T
Bought by
Kingston Kenneth and Kingston Joseph
Current Estimated Value
Home Financials for this Owner
Home Financials are based on the most recent Mortgage that was taken out on this home.
Original Mortgage
$480,000
Outstanding Balance
$428,105
Interest Rate
2.8%
Mortgage Type
New Conventional
Estimated Equity
$348,603
Purchase Details
Closed on
Nov 21, 2017
Sold by
Paxman Lu Wana
Bought by
Paxman Lu Wana and The Lu Wana Naegle Paxman Family Trust
Create a Home Valuation Report for This Property
The Home Valuation Report is an in-depth analysis detailing your home's value as well as a comparison with similar homes in the area
Home Values in the Area
Average Home Value in this Area
Purchase History
| Date | Buyer | Sale Price | Title Company |
|---|---|---|---|
| Kingston Kenneth | -- | Meridian Title | |
| Paxman Lu Wana | -- | None Available |
Source: Public Records
Mortgage History
| Date | Status | Borrower | Loan Amount |
|---|---|---|---|
| Open | Kingston Kenneth | $480,000 |
Source: Public Records
Tax History Compared to Growth
Tax History
| Year | Tax Paid | Tax Assessment Tax Assessment Total Assessment is a certain percentage of the fair market value that is determined by local assessors to be the total taxable value of land and additions on the property. | Land | Improvement |
|---|---|---|---|---|
| 2025 | $3,564 | $735,600 | $295,500 | $440,100 |
| 2024 | $3,564 | $685,700 | $284,100 | $401,600 |
| 2023 | $3,654 | $662,500 | $281,400 | $381,100 |
| 2022 | $3,748 | $668,700 | $275,900 | $392,800 |
| 2021 | $2,999 | $487,000 | $229,900 | $257,100 |
| 2020 | $21 | $461,400 | $229,900 | $231,500 |
| 2019 | $225 | $443,800 | $193,100 | $250,700 |
| 2018 | $2,748 | $407,300 | $179,900 | $227,400 |
| 2017 | $2,597 | $383,200 | $179,900 | $203,300 |
| 2016 | $2,387 | $330,900 | $179,900 | $151,000 |
| 2015 | $2,391 | $323,300 | $183,200 | $140,100 |
| 2014 | $2,168 | $288,600 | $166,100 | $122,500 |
Source: Public Records
Map
Nearby Homes
- 2683 W Carson Ln
- 6512 Timpanogos Way
- 6918 S Harvest Cir
- 8524 S Michele River Ave W Unit 109
- 6893 S 3200 W
- 6453 Fremont Peak Cir
- 2421 W 6900 S
- 3052 W Matterhorn Dr
- 3226 Tysonbrook Ct
- 6672 S 3335 W
- 2333 W Ledgewood Dr
- 3383 W 6880 S
- 2332 Broderick Dr
- 3305 W Kingsbrook Ave
- 6924 S 2160 W
- 1824 W 6200 S
- 2312 W Hidden Bend Cove Unit 107
- 6482 S Gold Medal Dr
- 6095 S Sierra Grande Dr
- 7361 S 2700 W