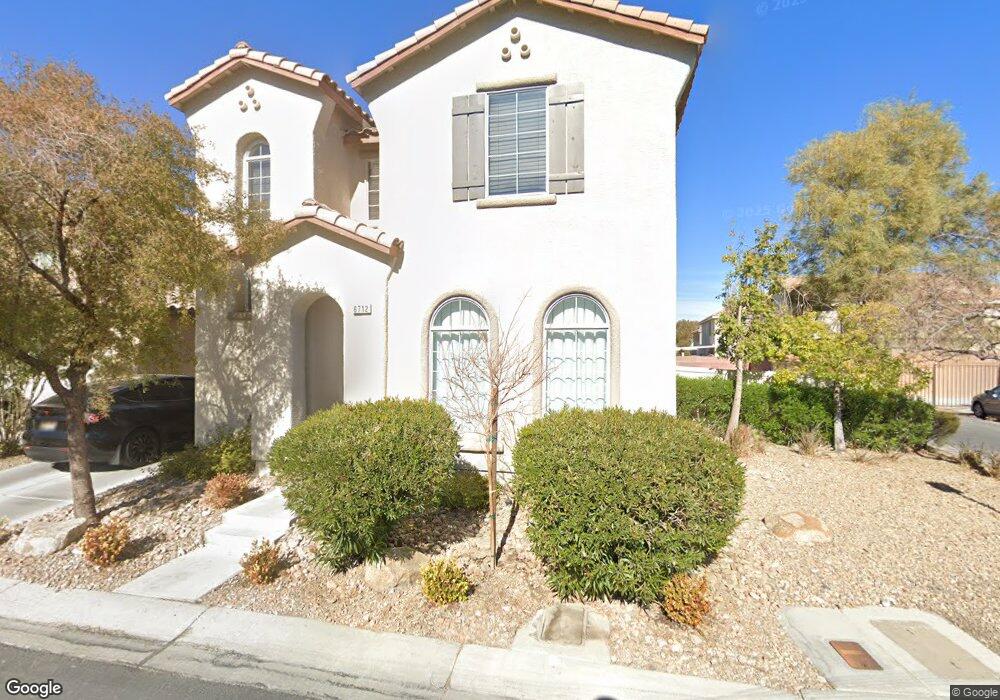
6712 Carlisle Grove Ave Las Vegas, NV 89139
Coronado Ranch NeighborhoodEstimated Value: $469,000 - $513,000
4
Beds
3
Baths
2,021
Sq Ft
$239/Sq Ft
Est. Value
About This Home
This home is located at 6712 Carlisle Grove Ave, Las Vegas, NV 89139 and is currently estimated at $482,867, approximately $238 per square foot. 6712 Carlisle Grove Ave is a home located in Clark County with nearby schools including Tony Alamo Elementary School, Lawrence & Heidi Canarelli Middle School, and Sierra Vista High School.
Ownership History
Date
Name
Owned For
Owner Type
Purchase Details
Closed on
Feb 3, 2012
Sold by
Pruna James Paul Martin
Bought by
Baizas Carla E
Current Estimated Value
Home Financials for this Owner
Home Financials are based on the most recent Mortgage that was taken out on this home.
Original Mortgage
$145,417
Outstanding Balance
$100,255
Interest Rate
4.25%
Mortgage Type
FHA
Estimated Equity
$382,612
Purchase Details
Closed on
Jan 5, 2012
Sold by
Lim Cheng S and Lim Hien C
Bought by
Baizas Carla E
Home Financials for this Owner
Home Financials are based on the most recent Mortgage that was taken out on this home.
Original Mortgage
$145,417
Outstanding Balance
$100,255
Interest Rate
4.25%
Mortgage Type
FHA
Estimated Equity
$382,612
Purchase Details
Closed on
Oct 29, 2007
Sold by
Richmond American Homes Of Nevada Inc
Bought by
Lim Cheng S and Lim Hien C
Home Financials for this Owner
Home Financials are based on the most recent Mortgage that was taken out on this home.
Original Mortgage
$288,184
Interest Rate
6.27%
Mortgage Type
Unknown
Create a Home Valuation Report for This Property
The Home Valuation Report is an in-depth analysis detailing your home's value as well as a comparison with similar homes in the area
Home Values in the Area
Average Home Value in this Area
Purchase History
| Date | Buyer | Sale Price | Title Company |
|---|---|---|---|
| Baizas Carla E | -- | Ticor Title Las Vegas | |
| Baizas Carla E | $149,200 | Ticor Title Las Vegas | |
| Lim Cheng S | $360,231 | Accommodation |
Source: Public Records
Mortgage History
| Date | Status | Borrower | Loan Amount |
|---|---|---|---|
| Open | Baizas Carla E | $145,417 | |
| Previous Owner | Lim Cheng S | $288,184 |
Source: Public Records
Tax History Compared to Growth
Tax History
| Year | Tax Paid | Tax Assessment Tax Assessment Total Assessment is a certain percentage of the fair market value that is determined by local assessors to be the total taxable value of land and additions on the property. | Land | Improvement |
|---|---|---|---|---|
| 2025 | $2,143 | $129,658 | $36,750 | $92,908 |
| 2024 | $2,081 | $129,658 | $36,750 | $92,908 |
| 2023 | $2,081 | $122,578 | $35,000 | $87,578 |
| 2022 | $2,215 | $108,362 | $28,700 | $79,662 |
| 2021 | $2,051 | $101,573 | $25,900 | $75,673 |
| 2020 | $1,902 | $100,095 | $25,200 | $74,895 |
| 2019 | $1,782 | $95,707 | $22,400 | $73,307 |
| 2018 | $1,701 | $88,831 | $18,550 | $70,281 |
| 2017 | $2,484 | $84,710 | $18,550 | $66,160 |
| 2016 | $1,593 | $74,479 | $12,250 | $62,229 |
| 2015 | $1,589 | $64,909 | $10,850 | $54,059 |
| 2014 | $1,792 | $50,924 | $6,300 | $44,624 |
Source: Public Records
Map
Nearby Homes
- 7882 Salt Spray Ct
- 7868 Salt Spray Ct
- 6747 Enchanted Cove Ct
- 6611 Ironbound Bay Ave
- 6684 Coronado Crest Ave
- 6784 Coronado Crest Ave
- 7746 Nautilus Shell St
- 7936 Avalon Mist St
- 7682 Calm Passage Ct
- 7000 Point Cabrillo Ct
- 7609 Belgian Lion St
- 6638 Melodic Ct
- 6454 Mount Palomar Ave
- 6655 Tranquil Seas Ct
- 8276 Sorrel St
- 7550 Jacaranda Bay St
- 6705 Philharmonic Ave
- 7520 Fontera Ct
- 6351 Briney Deep Ave
- 6785 Philharmonic Ave
- 6720 Carlisle Grove Ave
- 7896 Salt Spray Ct
- 6728 Carlisle Grove Ave
- 7895 Tidal Pool Ct
- 7912 Tolbooth St
- 6713 Carlisle Grove Ave
- 7918 Tolbooth St
- 7892 Salt Spray Ct Unit none
- 7892 Salt Spray Ct
- 6721 Carlisle Grove Ave
- 6736 Carlisle Grove Ave
- 7891 Tidal Pool Ct
- 7924 Tolbooth St
- 7924 Tolbooth St Unit none
- 7924 Tolbooth St Unit non
- 6729 Carlisle Grove Ave
- 6744 Carlisle Grove Ave
- 7886 Salt Spray Ct
- 6737 Carlisle Grove Ave