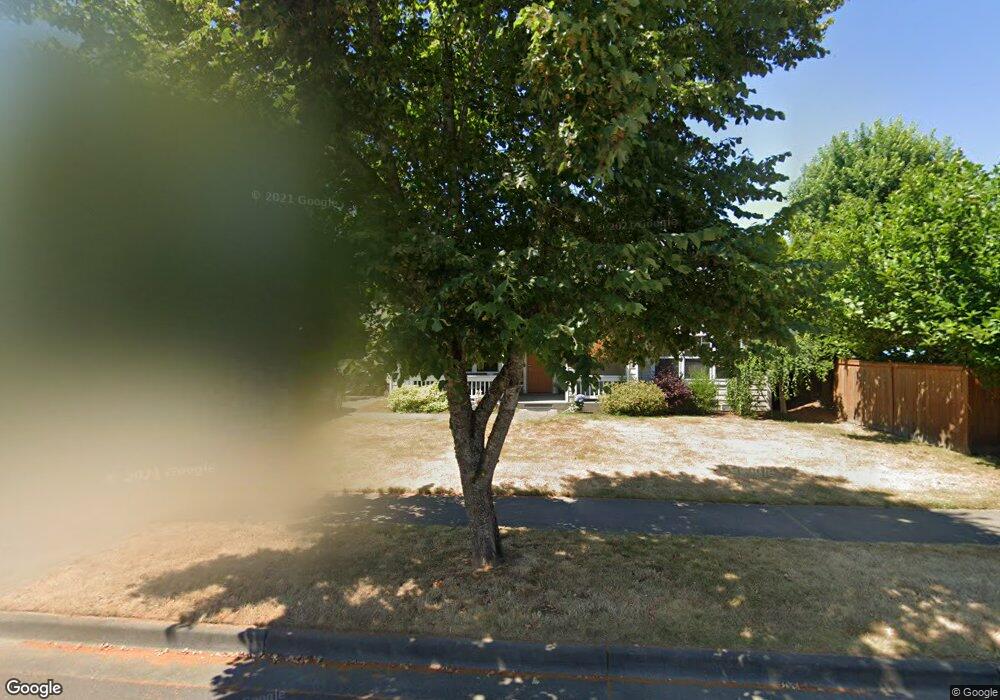
6712 Parker Rd E Sumner, WA 98390
Estimated Value: $653,245 - $693,000
3
Beds
3
Baths
1,978
Sq Ft
$340/Sq Ft
Est. Value
About This Home
This home is located at 6712 Parker Rd E, Sumner, WA 98390 and is currently estimated at $672,311, approximately $339 per square foot. 6712 Parker Rd E is a home located in Pierce County with nearby schools including Maple Lawn Elementary School, Sumner Middle School, and Sumner High School.
Ownership History
Date
Name
Owned For
Owner Type
Purchase Details
Closed on
Jul 23, 2003
Sold by
Cerenzia Cullivan Tracy
Bought by
Hansen Kurt D and Hansen Delinda D
Current Estimated Value
Home Financials for this Owner
Home Financials are based on the most recent Mortgage that was taken out on this home.
Original Mortgage
$164,000
Outstanding Balance
$69,146
Interest Rate
5.15%
Mortgage Type
Purchase Money Mortgage
Estimated Equity
$603,165
Purchase Details
Closed on
Oct 11, 2001
Sold by
Elliott Michael J
Bought by
Cerenzia Cullivan Tracy
Home Financials for this Owner
Home Financials are based on the most recent Mortgage that was taken out on this home.
Original Mortgage
$205,200
Interest Rate
6.87%
Purchase Details
Closed on
Nov 9, 1999
Sold by
Hearthside Homes Inc
Bought by
Elliott Michael J
Home Financials for this Owner
Home Financials are based on the most recent Mortgage that was taken out on this home.
Original Mortgage
$157,520
Interest Rate
3.85%
Create a Home Valuation Report for This Property
The Home Valuation Report is an in-depth analysis detailing your home's value as well as a comparison with similar homes in the area
Home Values in the Area
Average Home Value in this Area
Purchase History
| Date | Buyer | Sale Price | Title Company |
|---|---|---|---|
| Hansen Kurt D | $205,000 | Stewart Title | |
| Cerenzia Cullivan Tracy | $216,000 | Transnation Title Insurance | |
| Elliott Michael J | $196,900 | Transnation Title Insurance |
Source: Public Records
Mortgage History
| Date | Status | Borrower | Loan Amount |
|---|---|---|---|
| Open | Hansen Kurt D | $164,000 | |
| Previous Owner | Cerenzia Cullivan Tracy | $205,200 | |
| Previous Owner | Elliott Michael J | $157,520 | |
| Closed | Elliott Michael J | $19,690 |
Source: Public Records
Tax History
| Year | Tax Paid | Tax Assessment Tax Assessment Total Assessment is a certain percentage of the fair market value that is determined by local assessors to be the total taxable value of land and additions on the property. | Land | Improvement |
|---|---|---|---|---|
| 2025 | $5,622 | $600,700 | $250,100 | $350,600 |
| 2024 | $5,622 | $584,900 | $238,300 | $346,600 |
| 2023 | $5,622 | $543,400 | $238,300 | $305,100 |
| 2022 | $5,622 | $551,300 | $261,500 | $289,800 |
| 2021 | $5,364 | $406,900 | $159,800 | $247,100 |
| 2019 | $4,440 | $384,500 | $134,400 | $250,100 |
| 2018 | $4,645 | $355,500 | $115,400 | $240,100 |
| 2017 | $3,825 | $328,300 | $95,100 | $233,200 |
| 2016 | $3,124 | $255,200 | $67,800 | $187,400 |
| 2014 | $2,774 | $234,600 | $71,000 | $163,600 |
| 2013 | $2,774 | $211,900 | $64,700 | $147,200 |
Source: Public Records
Map
Nearby Homes
- 1825 Rainier Ct
- 16219 64th St E
- 15750 58th Street Ct E
- 16221 75th St E
- 14925 Rivergrove Dr E
- 7503 Village Dr
- 414 Sumner Ave
- 520 Sumner Ave Unit 524
- 15806 54th Street Ct E Unit 59C
- 15713 81st St E Unit 135
- 7608 145th Avenue Ct E Unit 30
- 15708 81st St E Unit 131
- 15120 Daffodil Street Ct E
- 1507 Wright Ave
- 14619 80th St E
- 14003 70th St E
- 14002 70th Street Ct E
- 1412 Everett St
- 1313 Washington St
- 1319 Wood Ave
- 6718 Parker Rd E
- 6724 Parker Rd E
- 15522 67th Street Ct E
- 15516 67th Street Ct E
- 15512 67th Street Ct E
- 6711 Parker Rd E
- 15512 67th (L40) Ct E
- 6726 Parker Rd E
- 6715 Parker Rd E
- 6721 Parker Rd E
- 67 XX Parker Rd
- 15510 67th Street Ct E
- 15505 67th Street Ct E
- 6808 Parker Rd E
- 6725 Parker Rd E
- 15621 68th Street Ct E
- 6801 Parker Rd E
- 6723 Parker Rd E
- 15612 67th Street Ct E
- 15620 68th Street Ct E
Your Personal Tour Guide
Ask me questions while you tour the home.