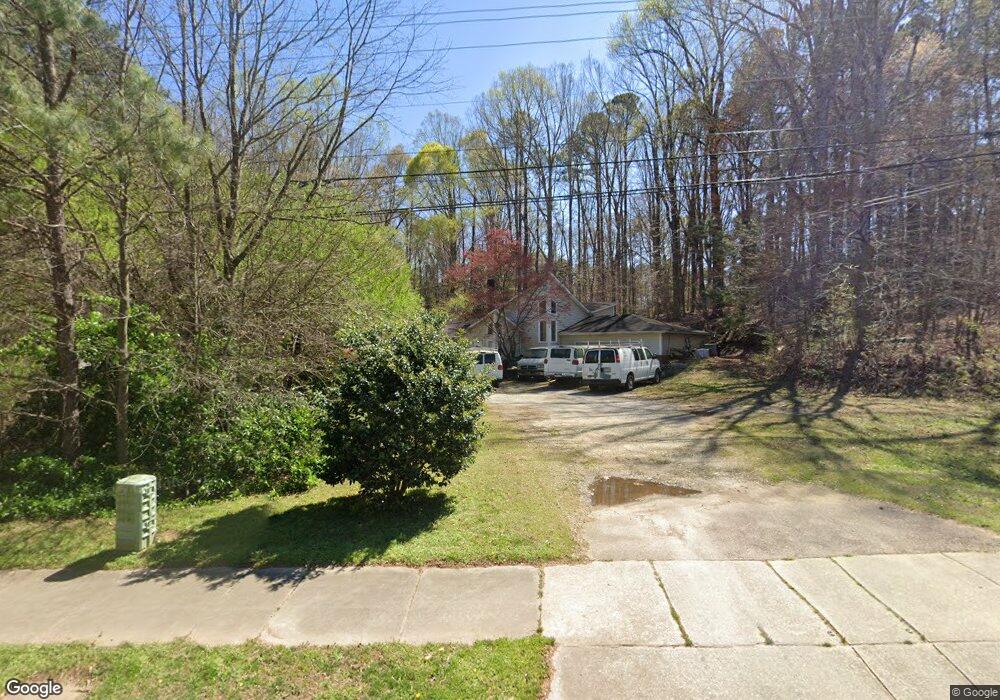
6713 Tryon Rd Cary, NC 27518
Middle Creek NeighborhoodEstimated Value: $576,000 - $829,000
3
Beds
3
Baths
2,980
Sq Ft
$246/Sq Ft
Est. Value
About This Home
This home is located at 6713 Tryon Rd, Cary, NC 27518 and is currently estimated at $731,877, approximately $245 per square foot. 6713 Tryon Rd is a home located in Wake County with nearby schools including Dillard Drive Magnet Elementary School, Dillard Drive Magnet Middle School, and TMSA Triangle - Triangle Math and Science Academy.
Ownership History
Date
Name
Owned For
Owner Type
Purchase Details
Closed on
Dec 15, 2009
Sold by
Five Stars Alliance Llc
Bought by
Park Si Young and Park Jung A
Current Estimated Value
Home Financials for this Owner
Home Financials are based on the most recent Mortgage that was taken out on this home.
Original Mortgage
$191,250
Outstanding Balance
$125,447
Interest Rate
5.01%
Mortgage Type
New Conventional
Estimated Equity
$606,430
Purchase Details
Closed on
Jun 5, 2002
Sold by
Kim Sun Wan and Kim Chong
Bought by
Five Stars Alliance Llc
Home Financials for this Owner
Home Financials are based on the most recent Mortgage that was taken out on this home.
Original Mortgage
$180,000
Interest Rate
6.85%
Purchase Details
Closed on
Jun 5, 2000
Sold by
Estate Of James E Wellington and Wellington Gregory G
Bought by
Kim Sung Wan and Kim Chong
Home Financials for this Owner
Home Financials are based on the most recent Mortgage that was taken out on this home.
Original Mortgage
$211,500
Interest Rate
8.14%
Create a Home Valuation Report for This Property
The Home Valuation Report is an in-depth analysis detailing your home's value as well as a comparison with similar homes in the area
Home Values in the Area
Average Home Value in this Area
Purchase History
| Date | Buyer | Sale Price | Title Company |
|---|---|---|---|
| Park Si Young | $255,000 | None Available | |
| Five Stars Alliance Llc | $225,000 | -- | |
| Kim Sung Wan | $235,000 | -- |
Source: Public Records
Mortgage History
| Date | Status | Borrower | Loan Amount |
|---|---|---|---|
| Open | Park Si Young | $191,250 | |
| Previous Owner | Five Stars Alliance Llc | $180,000 | |
| Previous Owner | Kim Sung Wan | $211,500 |
Source: Public Records
Tax History
| Year | Tax Paid | Tax Assessment Tax Assessment Total Assessment is a certain percentage of the fair market value that is determined by local assessors to be the total taxable value of land and additions on the property. | Land | Improvement |
|---|---|---|---|---|
| 2025 | $5,978 | $695,094 | $351,400 | $343,694 |
| 2024 | $5,848 | $695,094 | $351,400 | $343,694 |
Source: Public Records
Map
Nearby Homes
- 101 Springbrook Place
- 107 Larkwood Ln
- 105 Duckhead Point
- 105 Headlands Ln
- 0 SE Cary Pkwy Unit 2491180
- 101 Loch Haven Ln
- 6315 Tryon Rd
- 301 Glen Echo Ln Unit E
- 528 Spring Flower Ct
- 516 Spring Flower Ct
- 512 Spring Flower Ct
- 300 W Kirkfield Dr
- 124 Chattel Close
- 124 Rosewall Ln
- 104 Ayelsford Dr
- 1641 Kildonan Place
- 103 Lochberry Ln
- 103 Springberry Ct
- 406 Cricketfield Ln
- 106 Brannigan Place
- 103 E Green Forest Dr
- 105 Summerwinds Dr
- 103 Summerwinds Dr
- 101 Summerwinds Dr
- 105 E Green Forest Dr
- 6655 Tryon Rd
- 102 Frostwood Dr
- 201 Summerwinds Dr
- 107 E Green Forest Dr
- 104 Frostwood Dr
- 100 W Green Forest Dr
- 104 Summerwinds Dr
- 104 E Green Forest Dr
- 102 Summerwinds Dr
- 200 Summerwinds Dr
- 101 Larkwood Ln
- 106 Frostwood Dr
- 103 Larkwood Ln
- 109 E Green Forest Dr
- 100 Summerwinds Dr
Your Personal Tour Guide
Ask me questions while you tour the home.