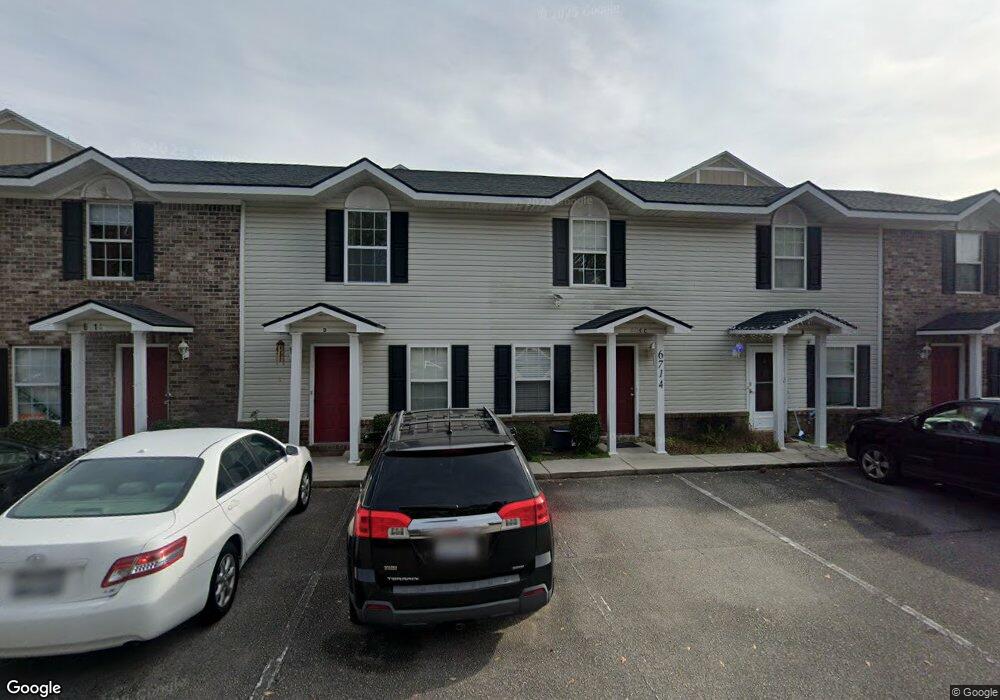
6714 Bryant St Unit C Myrtle Beach, SC 29572
Grande Dunes NeighborhoodEstimated Value: $147,000 - $201,000
2
Beds
2
Baths
960
Sq Ft
$185/Sq Ft
Est. Value
About This Home
This home is located at 6714 Bryant St Unit C, Myrtle Beach, SC 29572 and is currently estimated at $177,810, approximately $185 per square foot. 6714 Bryant St Unit C is a home located in Horry County with nearby schools including Myrtle Beach Child Development Center, Myrtle Beach Elementary School, and Myrtle Beach Primary School.
Ownership History
Date
Name
Owned For
Owner Type
Purchase Details
Closed on
Oct 20, 2015
Bought by
Richardson J Ho
Current Estimated Value
Purchase Details
Closed on
Mar 21, 2014
Sold by
Anne Belle Llc
Bought by
Richardson Hazel S and Richardson Hoyt
Purchase Details
Closed on
Mar 18, 2010
Sold by
Eaglin Enterprises Inc
Bought by
Anne Belle Llc
Purchase Details
Closed on
Mar 19, 2008
Sold by
Amend Daniel
Bought by
Wilson Gordon P
Purchase Details
Closed on
May 5, 2003
Sold by
Seacroft Construction & Development Co I
Bought by
Eaglin Enterprises Inc
Home Financials for this Owner
Home Financials are based on the most recent Mortgage that was taken out on this home.
Original Mortgage
$65,920
Interest Rate
5.57%
Mortgage Type
Adjustable Rate Mortgage/ARM
Purchase Details
Closed on
Aug 15, 2001
Sold by
Better Homes Of Myrtle Beach Inc
Bought by
Seacroft Construction & Development Co I
Create a Home Valuation Report for This Property
The Home Valuation Report is an in-depth analysis detailing your home's value as well as a comparison with similar homes in the area
Home Values in the Area
Average Home Value in this Area
Purchase History
| Date | Buyer | Sale Price | Title Company |
|---|---|---|---|
| Richardson J Ho | -- | -- | |
| Richardson Hazel S | $71,000 | -- | |
| Anne Belle Llc | $240,000 | -- | |
| Wilson Gordon P | $90,000 | -- | |
| Eaglin Enterprises Inc | $247,200 | -- | |
| Seacroft Construction & Development Co I | -- | -- |
Source: Public Records
Mortgage History
| Date | Status | Borrower | Loan Amount |
|---|---|---|---|
| Previous Owner | Eaglin Enterprises Inc | $65,920 |
Source: Public Records
Tax History Compared to Growth
Tax History
| Year | Tax Paid | Tax Assessment Tax Assessment Total Assessment is a certain percentage of the fair market value that is determined by local assessors to be the total taxable value of land and additions on the property. | Land | Improvement |
|---|---|---|---|---|
| 2024 | $1,433 | $12,004 | $6,000 | $6,004 |
| 2023 | $1,433 | $4,899 | $828 | $4,071 |
| 2021 | $1,324 | $5,448 | $900 | $4,548 |
| 2020 | $1,263 | $5,448 | $900 | $4,548 |
| 2019 | $1,263 | $5,448 | $900 | $4,548 |
| 2018 | $0 | $4,260 | $720 | $3,540 |
| 2017 | $1,120 | $4,260 | $720 | $3,540 |
| 2016 | -- | $4,260 | $720 | $3,540 |
| 2015 | $1,108 | $4,260 | $720 | $3,540 |
| 2014 | $1,052 | $4,158 | $720 | $3,438 |
Source: Public Records
Map
Nearby Homes
- 6703 Bryant St Unit A
- 6703 Bryant St
- 6708 Bryant St Unit E
- 6702 Jefferson Place Unit F2
- 6702 Jefferson Place Unit C3
- 6702 Jefferson Place Unit B6
- 6702 Jefferson Place Unit C6
- 6706 Bryant St Unit C
- TBD Bryant St. Bryant St Unit BRYANT DR; PARCEL 2-
- 6703 Jefferson Place Unit B1
- 6703 Jefferson Place Unit B-2
- 712 67th Ave N Unit 2A
- 712 67th Ave N Unit 1E
- TBD 67th Ave N
- 6624 Lagoon Place
- 6619 Colonial Dr
- 600 65th Ave N Unit 7
- 7268 Seville Dr
- 843 67th Ave N
- 6510 Wildwood Trail Unit 8
- 6714 Bryant St Unit 6714-B North Lake
- 6714 Bryant St
- 6714 Bryant St Unit A
- 6714 Bryant St Unit D
- 6714 Bryant St Unit B
- 6714 Bryant St Unit A
- 6716 Bryant St
- 6716 Bryant St
- 6716 Bryant St Unit E
- 6716 Bryant St Unit D
- 6716 Bryant St Unit C
- 6716 Bryant St Unit B
- 6716 Bryant St Unit A
- 6712 Bryant St Unit 6712-A Bryant Street
- 6712 Bryant St Unit E
- 6712 Bryant St Unit D
- 6712 Bryant St Unit C
- 6712 Bryant St Unit B
- 6712 Bryant St Unit A
- 6718 Bryant St Unit A