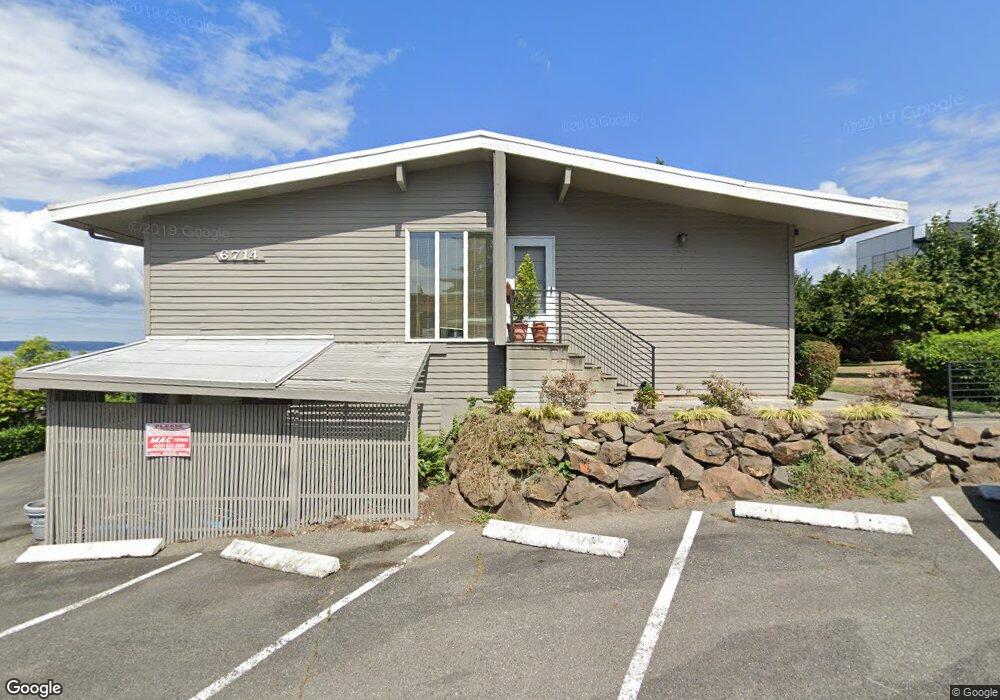
6714 Lk Wash Blvd NE Unit B3 Kirkland, WA 98033
Lakeview Kirkland NeighborhoodEstimated Value: $651,618 - $799,000
2
Beds
1
Bath
820
Sq Ft
$872/Sq Ft
Est. Value
About This Home
This home is located at 6714 Lk Wash Blvd NE Unit B3, Kirkland, WA 98033 and is currently estimated at $715,405, approximately $872 per square foot. 6714 Lk Wash Blvd NE Unit B3 is a home located in King County with nearby schools including Lakeview Elementary School, Kirkland Middle School, and Lake Washington High School.
Ownership History
Date
Name
Owned For
Owner Type
Purchase Details
Closed on
Dec 20, 2022
Sold by
Laughlin Jessica
Bought by
Fredric Sandra
Current Estimated Value
Home Financials for this Owner
Home Financials are based on the most recent Mortgage that was taken out on this home.
Original Mortgage
$100,000
Outstanding Balance
$96,807
Interest Rate
6.61%
Mortgage Type
New Conventional
Estimated Equity
$618,598
Purchase Details
Closed on
Sep 18, 2018
Sold by
Moynihan Lynda A
Bought by
Laughlin Jessica
Home Financials for this Owner
Home Financials are based on the most recent Mortgage that was taken out on this home.
Original Mortgage
$446,400
Interest Rate
4.5%
Mortgage Type
New Conventional
Purchase Details
Closed on
Mar 15, 1988
Sold by
Edwards Jacqueline
Bought by
Moynihan Lynda A
Create a Home Valuation Report for This Property
The Home Valuation Report is an in-depth analysis detailing your home's value as well as a comparison with similar homes in the area
Home Values in the Area
Average Home Value in this Area
Purchase History
| Date | Buyer | Sale Price | Title Company |
|---|---|---|---|
| Fredric Sandra | $600,000 | Stewart Title | |
| Laughlin Jessica | $496,000 | Cw Title | |
| Moynihan Lynda A | $66,000 | -- |
Source: Public Records
Mortgage History
| Date | Status | Borrower | Loan Amount |
|---|---|---|---|
| Open | Fredric Sandra | $100,000 | |
| Previous Owner | Laughlin Jessica | $446,400 |
Source: Public Records
Tax History Compared to Growth
Tax History
| Year | Tax Paid | Tax Assessment Tax Assessment Total Assessment is a certain percentage of the fair market value that is determined by local assessors to be the total taxable value of land and additions on the property. | Land | Improvement |
|---|---|---|---|---|
| 2024 | $5,444 | $663,000 | $413,600 | $249,400 |
| 2023 | $6,083 | $706,000 | $413,600 | $292,400 |
| 2022 | $4,467 | $564,000 | $330,900 | $233,100 |
| 2021 | $4,404 | $495,000 | $289,500 | $205,500 |
| 2020 | $4,665 | $449,000 | $289,500 | $159,500 |
| 2018 | $4,731 | $565,000 | $248,100 | $316,900 |
| 2017 | $3,592 | $463,000 | $227,500 | $235,500 |
| 2016 | $2,777 | $364,000 | $206,800 | $157,200 |
| 2015 | $2,634 | $275,000 | $165,400 | $109,600 |
| 2014 | -- | $251,000 | $165,400 | $85,600 |
| 2013 | -- | $294,000 | $165,400 | $128,600 |
Source: Public Records
Map
Nearby Homes
- 6620 Lake Washington Blvd NE Unit 101
- 6620 Lake Washington Blvd NE Unit 303
- 8 10th Ave S
- 10135 NE 64th St Unit A
- 10218 NE 65th St
- 832 Lake St S
- 6304 Lakeview Dr
- 6211 Lake Washington Blvd NE
- 818 Lake St S Unit 818
- 6209 Lake Washington Blvd NE
- 332 10th Ave S
- 727 2nd St S
- 725 1st St S Unit 302
- 725 1st St S Unit 104
- 721 2nd St S
- 733 Lake St S Unit 305
- 733 Lake St S Unit 202
- 10110 NE 60th St Unit 107
- 702 2nd St S
- 10207 NE 60th St
- 6714 Lk Wash Blvd NE Unit 7
- 6714 Lk Wash Blvd NE Unit A1
- 6714 Lk Wash Blvd NE Unit B7
- 6714 Lk Wash Blvd NE Unit B5
- 6714 Lk Wash Blvd NE Unit B4
- 6714 Lk Wash Blvd NE Unit B6
- 6714 Lk Wash Blvd NE Unit B2
- 6714 Lake Washington Blvd NE Unit 7
- 6714 Lake Washington Blvd NE Unit 2
- 6714 Lake Washington Blvd NE Unit B-7
- 6714 Lake Washington Blvd NE Unit 4
- 6714 Lake Washington Blvd NE Unit 3
- 6625 Lakeview Dr Unit B-102
- 6625 Lakeview Dr Unit B202
- 6625 Lakeview Dr Unit B201
- 6625 Lakeview Dr
- 6627 Lakeview Dr Unit A203
- 6627 Lakeview Dr Unit A101
- 6627 Lakeview Dr Unit A104
- 6627 Lakeview Dr Unit A302