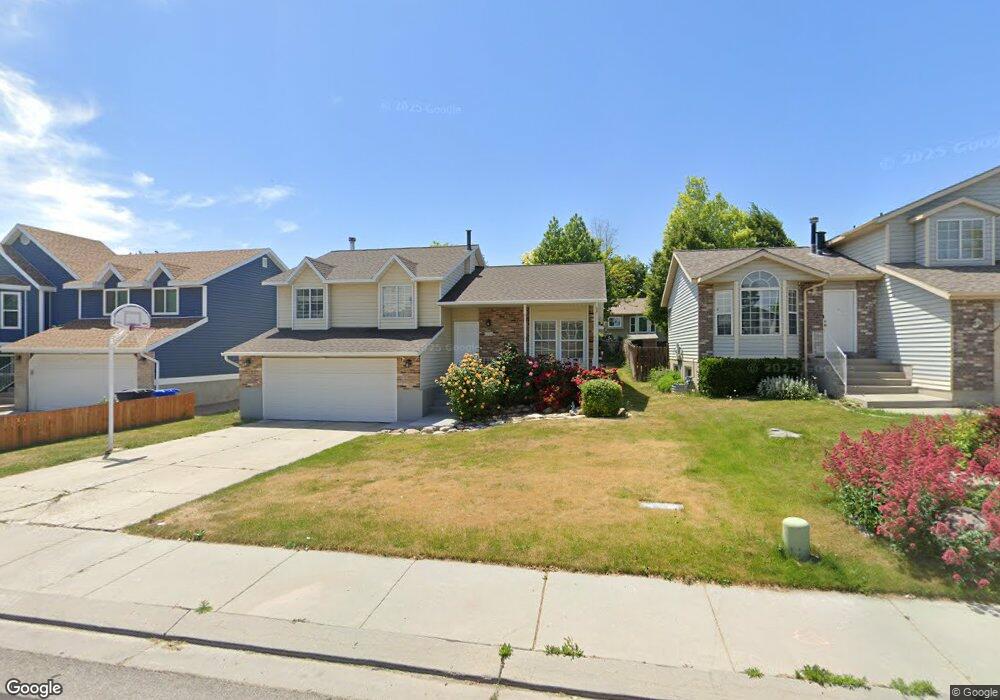
6714 Marshrock Rd West Jordan, UT 84081
Oquirrh NeighborhoodEstimated Value: $493,000 - $538,000
4
Beds
2
Baths
2,176
Sq Ft
$233/Sq Ft
Est. Value
About This Home
This home is located at 6714 Marshrock Rd, West Jordan, UT 84081 and is currently estimated at $508,081, approximately $233 per square foot. 6714 Marshrock Rd is a home located in Salt Lake County with nearby schools including Mountain Shadows School, West Hills Middle School, and Copper Hills High School.
Ownership History
Date
Name
Owned For
Owner Type
Purchase Details
Closed on
Oct 24, 2024
Sold by
Chambers Shauna and Chambers Robert
Bought by
Nieto Sergio A Angulo and Rincon Karol D
Current Estimated Value
Home Financials for this Owner
Home Financials are based on the most recent Mortgage that was taken out on this home.
Original Mortgage
$490,943
Outstanding Balance
$485,634
Interest Rate
6.2%
Mortgage Type
FHA
Estimated Equity
$22,447
Purchase Details
Closed on
Sep 19, 2013
Sold by
Brown Ellen Ann
Bought by
Chambers Shauna and Chambers Robert
Purchase Details
Closed on
Nov 10, 2004
Sold by
Chambers Robert and Chambers Shauna
Bought by
Brown Ellen Ann
Purchase Details
Closed on
Sep 23, 1999
Sold by
Groft Andrew J and Groft Leslie A
Bought by
Chambers Robert and Chambers Shauna
Create a Home Valuation Report for This Property
The Home Valuation Report is an in-depth analysis detailing your home's value as well as a comparison with similar homes in the area
Home Values in the Area
Average Home Value in this Area
Purchase History
| Date | Buyer | Sale Price | Title Company |
|---|---|---|---|
| Nieto Sergio A Angulo | -- | Old Republic Title | |
| Chambers Shauna | -- | None Available | |
| Brown Ellen Ann | -- | -- | |
| Chambers Robert | -- | Security Title Ins Agency |
Source: Public Records
Mortgage History
| Date | Status | Borrower | Loan Amount |
|---|---|---|---|
| Open | Nieto Sergio A Angulo | $490,943 | |
| Closed | Nieto Sergio A Angulo | $490,943 |
Source: Public Records
Tax History Compared to Growth
Tax History
| Year | Tax Paid | Tax Assessment Tax Assessment Total Assessment is a certain percentage of the fair market value that is determined by local assessors to be the total taxable value of land and additions on the property. | Land | Improvement |
|---|---|---|---|---|
| 2025 | $2,580 | $484,400 | $97,800 | $386,600 |
| 2024 | $2,580 | $436,100 | $92,300 | $343,800 |
| 2023 | -- | $410,100 | $88,700 | $321,400 |
| 2022 | $0 | $406,200 | $87,000 | $319,200 |
| 2021 | $2,771 | $330,300 | $66,900 | $263,400 |
| 2020 | $2,097 | $287,000 | $66,900 | $220,100 |
| 2019 | $2,045 | $273,800 | $63,100 | $210,700 |
| 2018 | $0 | $253,000 | $63,100 | $189,900 |
| 2017 | $1,682 | $219,000 | $63,100 | $155,900 |
| 2016 | $1,658 | $203,100 | $63,100 | $140,000 |
| 2015 | $1,480 | $174,800 | $62,900 | $111,900 |
| 2014 | -- | $167,000 | $61,100 | $105,900 |
Source: Public Records
Map
Nearby Homes
- 6706 Marshrock Rd
- 6635 S Milfoil Cir
- 4983 Shooting Star Ave
- 5183 W Cadenza Dr
- 6568 S 5180 W
- 4909 Sakura Ct
- 5281 Saguaro Dr
- 4891 Calyx Cir
- 6928 Beargrass Rd
- 4888 Ticklegrass Rd
- 4790 W Barletta Ct
- 6437 S Lobelia Dr
- 6398 S Lobelia Dr
- 6839 S Cyclamen Dr
- 4785 Foggio Ct
- 6811 S Etruscan Way
- 4763 W Arno Way
- 6489 S Daffodil Way
- 6853 Mullien Dr Unit 5420
- 6900 S Florentine Way
- 6722 Marshrock Rd
- 6706 S Marshrock Rd
- 6698 Marshrock Rd
- 6698 S Marshrock Rd
- 6698 S Marshrock Rd
- 6719 Beargrass Rd
- 6730 Marshrock Rd
- 6711 Beargrass Rd
- 6711 S Beargrass Rd
- 6725 Beargrass Rd
- 6725 S Beargrass Rd
- 6705 Beargrass Rd
- 6713 S Marshrock Rd
- 6731 Beargrass Rd
- 6713 Marshrock Rd
- 6719 Marshrock Rd
- 6692 Marshrock Rd
- 6692 S Marshrock Rd
- 6705 S Marshrock Rd
- 6705 Marshrock Rd